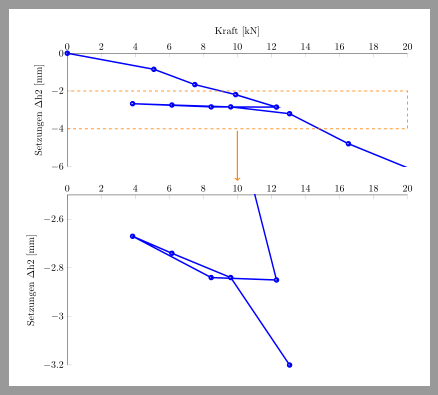
Könnte mir von euch jemand sagen wie ich einen Achsen Abschnittsweise vergrössern war.
Ich würde gerne einen Graphen darstellen der zwischen den Zahlen -2 und -3 eine Grössere Auflösung darstellen.
\documentclass[11pt]{article}
\usepackage[T1]{fontenc}
\usepackage[utf8]{inputenc}
\usepackage{pgfplots}
\pgfplotsset{compat=1.13}
\usetikzlibrary{decorations.pathreplacing}
\begin{document}
\begin{figure}
\begin{tikzpicture}
\begin{axis}[
width=12cm,
height=4cm,
scale only axis,
xmin=0,
xmax=20,
xlabel={Kraft [kN]},
ymin=-6,
ymax=0,
ylabel={Setzungen $\Delta$h2 [mm]},
axis x line*=top, %bottom, %top,
axis y line*=left
]
\addplot [
color= blue,
line width=1.5pt,
mark size=2.0pt,
%only marks,
mark=ball,
mark options={solid},
forget plot
]
table[row sep=crcr]{
0 0\\
5.09 -0.85 \\
7.50 -1.66 \\
9.90 -2.19 \\
12.30 -2.85 \\
8.46 -2.84 \\
3.84 -2.67 \\
6.15 -2.74 \\
9.61 -2.84 \\
13.07 -3.20 \\
16.53 -4.79 \\
21.14 -6.48 \\
% 26.91 -8.26 \\
% 38.44 -14.28 \\
% 57.66 -22.34 \\
% 79.19 -32.18 \\
% 0 0.384\\
% 0 -20\\
};
\draw [very thick,red](0.384,0) -- (0.384,-6);
\end{axis}
\end{tikzpicture}\vspace{-2ex}
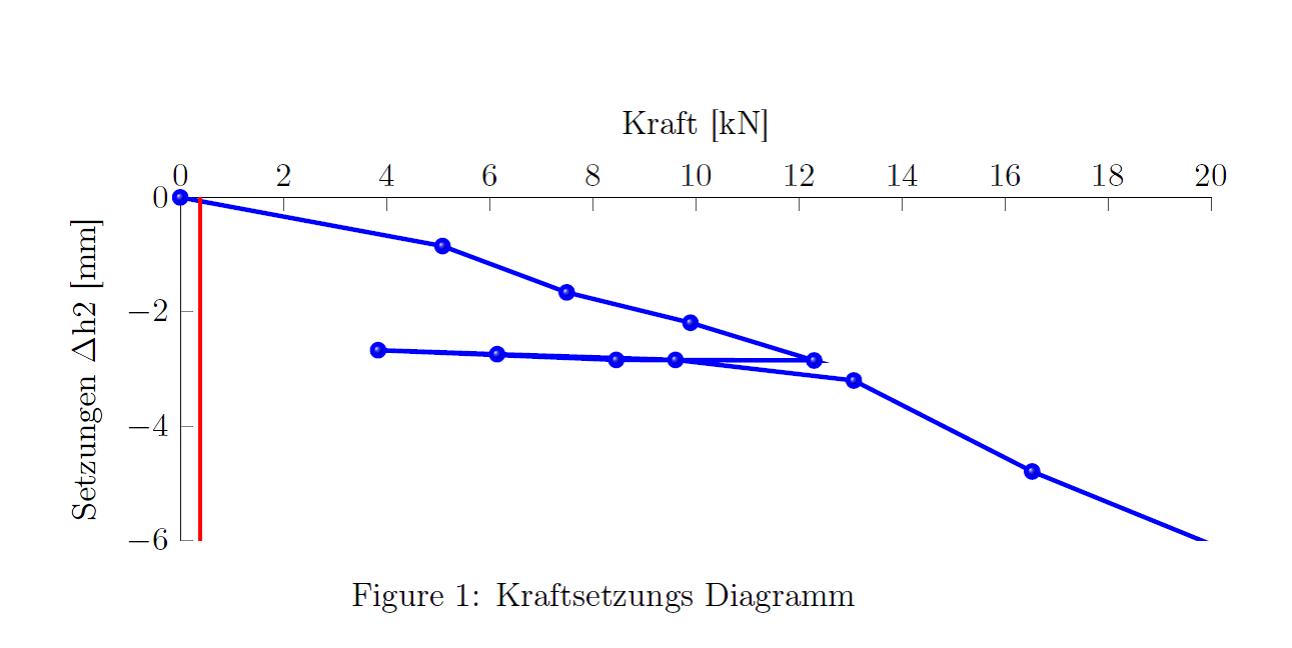
\caption{Kraftsetzungs Diagramm}
\label{KraftSetzDia}
\end{figure}
\end{document}
Danke für Eure Hilfe
Bin in der Letzten zeit viel im Forum und lese mir viel hilfreich ding durch
Ich danke euch allen sehr für eure unterstützung