ich versuche mich derzeit am Erstellen von Diagrammen mittels Latex resp. pgfplots/tikz..
Soweit bin ich ganz zufrieden. Mein Minimalbeispiel gibt schon den richtigen Weg vor
\documentclass[border=10pt]{standalone}
\usepackage{pgfplots}
\begin{document}
\begin{tikzpicture}
\begin{axis}[title = ,
xbar,
y axis line style = { opacity = 0 },
axis x line = none,
tickwidth = 0pt,
enlarge y limits = 1.5,
enlarge x limits = 0.02,
symbolic y coords = {Wittmann et. al, Zhao et. al},
nodes near coords,
reverse legend,
legend style={draw=none,legend cell align=left},
legend style={at={(1,1)},xshift=-2.5cm,anchor=north west},
]
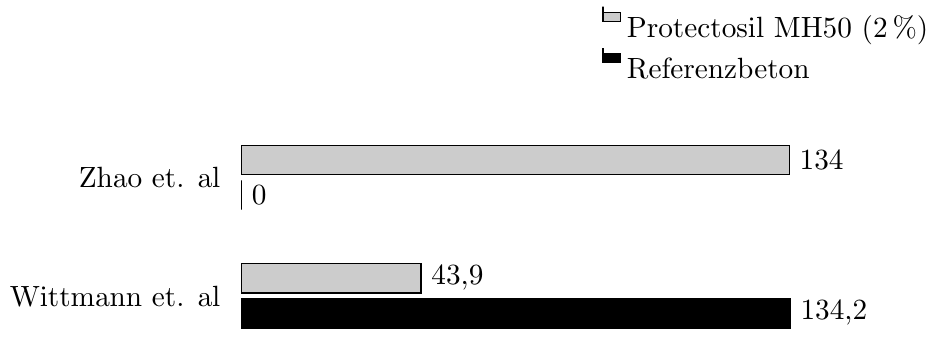
\addplot coordinates { (134.2,Wittmann et. al) (0,Zhao et. al)};
\addplot coordinates { (43.9,Wittmann et. al) (134,Zhao et. al)};
\legend{Referenzbeton, Protectosil MH50 (2\%)}
\end{axis}
\end{tikzpicture}
\end{document}
- Zum einen Frage ich mich warum ich vier Einträge habe, wenn ich doch nur zwei definiert habe
- Zum anderen würde ich gerne wissen, wie ich andere Farben einbinden und ob man die Farben schwarz darstellen kann
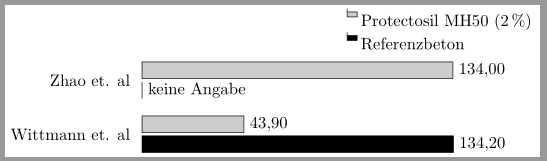
- Dann würde ich gerne die Null durch den Text "keine Angabe" ersetzen. Ist dies möglich?
Danke für eure Hilfe.
Gruß
pauabaer[/list]