So, nachdem ich von dem Kollegen nichts mehr höre versuch ich es hier weiter

Danke schon mal für den Support

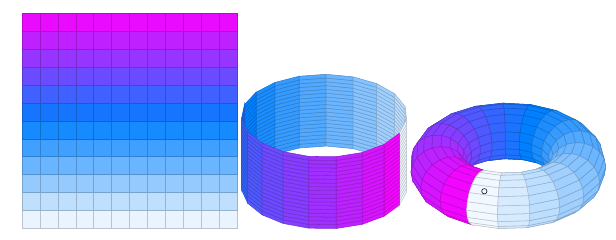
Der Torus gefällt mir eigentlich ganz gut:
Edit: CODE GELÖSCHT, UPDATE UNTEN
Ich bekomme es aber weder hin den Torus einfarbig (schwarze Rahmenlinien und weiße Füllung) zu gestalten oder irgendwo anders hin zu schieben. Darüberhinaus habe ich eine Animation gefunden die mein vorhaben darstellt:
Quelle:
http://mathematica.stackexchange.com/qu ... to-a-torus
Das zeigt Problem zwei: Irgendwie sollte das Rechteck, der Zylinder und der Torus aus dem selben Gitter bestehen

Danke Feuersänger. Und Respekt für die Arbeit die du mit dem Paket gehabt haben musst

Edit: Update
Ich bin nun drauf gekommen, das ich die Grafiken am einfachsten mit der Grupplot Umgebung platzieren kann. Das klappt soweit so gut:
\documentclass{standalone}

\usepackage{pgfplots}
\usetikzlibrary{pgfplots.groupplots}

\begin{document}
\pgfplotsset{
   hide axis,
   colormap/blackwhite,
   %
   % allow \draw ... instructions inside of an axis to leave the
   % outline of the axis:
   clip=false,
}
\pgfplotsset{
   hide axis,
   colormap/cool,
   %
   % allow \draw ... instructions inside of an axis to leave the
   % outline of the axis:
   clip=false,
}
\begin{tikzpicture}
\begin{groupplot}[
    group style={
        group name=my plots,
        group size=3 by 1,
        ylabels at=edge left
    },
    footnotesize,
    width=5cm,
    height=4cm,
    tickpos=left,
    ytick align=outside,
    xtick align=outside,
    enlarge x limits=false,
	domain=-10:10
]
% Lattice
\nextgroupplot
%	\draw[step=1.0,black] ({axis cs:-2,-2}) grid ({axis cs:5,5});

% Cylinder
\nextgroupplot
  \addplot3[
         surf,
      samples=20,
      %samples y=31,
      domain=1:5,
      y domain=0:2*pi,
      z buffer=sort,
      variable=\u,variable y=\v,
      point meta=v,
   ]
         ({1*cos(deg(v))},{1*sin(deg(v))},{u});

% Torus
\nextgroupplot
     \addplot3[
     	surf,
         samples=20,
         domain=0:2*pi,
         y domain=0:2*pi,
         z buffer=sort,
       variable=\u,variable y=\v,
       point meta=v,
       ]
       ( {(1+0.5*cos(deg(u)))*cos(deg(v+pi))},
         {(1+0.5*cos(deg(u)))*sin(deg(v+pi))},
         {0.5*sin(deg(u))}
       );
       \end{groupplot}

\draw [draw,thick,step=0.5cm] (0,0) node (v1) {} grid (3,2);
%\draw [thick,bend angle=-45, bend left] (0,1.5) to (-0.5,1.5) to (1.5,0) to (3.5,1.5) to (3,1.5);

%\draw [thick,bend angle=-45, bend left] (6,2) to (4.5,2) to (4.5,0) to (6,0.2);

\node at (-0.5,1.5) {A};
\node at (-0.5,0) {B};
\node at (3.5,1.5) {C};
\node at (3.5,0) {D};

\end{tikzpicture}
\end{document}
Was nun fehlt ist:
- Das ganze soll einfach nur einfarbig Schwarz/Weiß sein
- Die Anzahl Knoten/die Gittergröße sollte immer gleich sein
- Die Tikz Pfeile und das Gitter müssen irgendwie als "Overlay" da rein. Ich habe zwar gesehen, dass man das wohl einfach zum "\nextgroupplot" dazupackt, aber Tikzedt meckert am Doppelpunkt bei axis cs:
- Der Blickwinkel dürfte gerne von etwas weiter oben sein ...
Edit: Ich habe noch eine neue Version Code angehängt. Das ist ja ganz nett, aber irgendwie sieht es nach nix aus ... hat jemand einen Vorschlag? Ansonsten lass ichs dann doch weg ...