Ich schreibe hier meinen 2 Beitrag bzw. Frage
ich habe aus der Hilfe die mir in meiner 1 Frage gegeben wurde diesen Quelltext entwickelt.
gibt es hier noch andere möglichkeiten für Koordinaten zu diesen Anfang
nodes near coords={
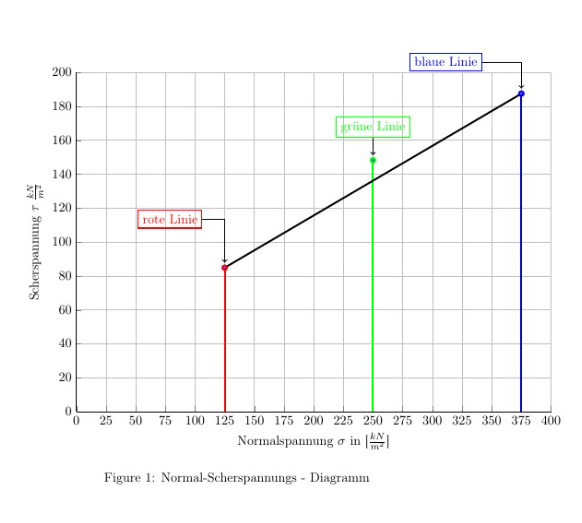
Ich würde gerne Textboxen mit sogenanten fahnen verwenden
könnte mir jemand mitteilen wie man das macht.
Danke
\begin{filecontents*}{NS.dat}
125 0
125 84.85
250 0
250 148.22
375 0
375 187.5
\end{filecontents*}
\begin{filecontents*}{NS2.dat}
0 33.525
125 84.85
375 187.5
\end{filecontents*}
\documentclass[11pt]{article}
\usepackage[T1]{fontenc}
\usepackage{pgfplots}
\pgfplotsset{compat=1.12} % Wenn nötig, Versionsnummer runter oder auf »newest« setzen
\begin{document}
\begin{figure}
\begin{tikzpicture}
\begin{axis}[
width=14cm,
height=10cm,
scale only axis,
xmin=0,
xmax=400,
xlabel={Normalspannung $\sigma$ in [$\frac{kN}{m^2}$]},
ymin=0,
ymax=200,
ylabel={Scherspannung $\tau$ $\frac{kN}{m^2}$},
axis x line*=bottom, %top,
axis y line*=left,
grid=major,
every axis plot/.append style={
line width=1.5pt,
mark size=2pt,
mark=ball,forget plot,
visualization depends on={x \as \myvalue},
},
point meta=y,
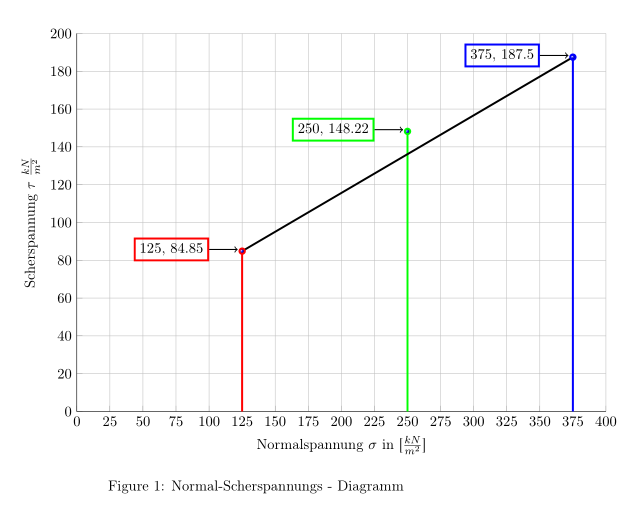
nodes near coords={
\ifdim \myvalue pt=125pt \pgfmathprintnumber{\pgfplotspointmeta}\fi
\ifdim \myvalue pt=250pt \pgfmathprintnumber{\pgfplotspointmeta}\fi
\ifdim \myvalue pt=375pt \pgfmathprintnumber{\pgfplotspointmeta}\fi
},
nodes near coords style={text=black}
]
\addplot [red] table[restrict expr to domain={\thisrowno{0}}{0:125}] {NS.dat};
\addplot [green] table[restrict expr to domain={\thisrowno{0}}{250:250}] {NS.dat};
\addplot [blue] table[restrict expr to domain={\thisrowno{0}}{375:375}] {NS.dat};
\addplot [black] table[restrict expr to domain={\thisrowno{0}}{125:375}] {NS2.dat};
% \addplot [orange] table[restrict expr to domain={\thisrowno{0}}{0:375}] {datenNS.dat};
\end{axis}
\end{tikzpicture}
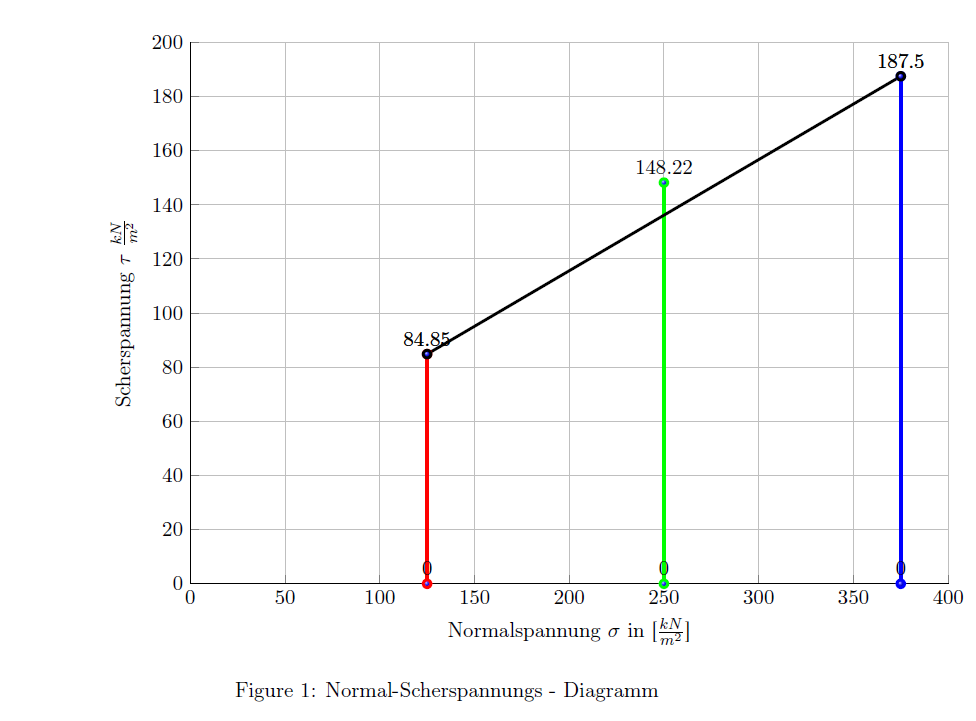
\caption{Normal-Scherspannungs - Diagramm}
\end{figure}
\end{document}
Ebenso intressant wäre es zu wissen wie man die Markierungen Mark=ball für die einzelnen Linien/Graphen steuer kann.
Kann mir noch jemand helfen zu verstehen wie die Syntax von Pgfplots über haupt zu verstehen bzw anzu wenden ist.
Danke für die Hilfe