Probleme mit TikZ - Anpassung eines Würfels

Du verbindest Knoten und nicht Koordinaten. Das gibt keine geschlossenen Kurven:nils_trash@hotmail.com hat geschrieben: Ich sitze aktuell daran einzelne Flächen einzufärben, hierfür wollte ich eigentlich
\draw[fill=yellow,opacity=0.6]
verwenden, jedoch bleibt die gewünschte Färbung der Fläche aus. Woran kann dies liegen, bzw. wie müsste ich den Code dafür anpassen?
\documentclass{article}
\usepackage{tikz}

\begin{document}
\begin{tikzpicture}[]
\node  (A) at (0,0) {A};
\node  (B) at (1,1) {B};
\node  (C) at (0,1) {C};
\filldraw[red](A)--(B)--(C)--(A);

\end{tikzpicture}

\begin{tikzpicture}[]
\node  (A) at (0,0) {A};
\node  (B) at (1,1) {B};
\node  (C) at (0,1) {C};
\filldraw[red](A.center)--(B.center)--(C.center)--cycle;
\end{tikzpicture}


\end{document}
Ulrike Fischer
www.troubleshooting-tex.de
www.troubleshooting-tex.de
-
nils_trash@hotmail.com
- Forum-Anfänger

- Beiträge: 10
- Registriert: Do 18. Okt 2018, 11:03
Vielen Dank für die Hilfe. Ich hatte unter 17.11 nachgelesen
"You can also just use (x) as a coordinate. In most cases, this gives the same coordinate as (x.center)."
Vielen Dank für die Korrektur.
Ich hätte jetzt lediglich das Problem, dass sich die Intensität an den Kreisen addiert. Besteht eine Möglichkeit dies zu verhindern?
"You can also just use (x) as a coordinate. In most cases, this gives the same coordinate as (x.center)."
Vielen Dank für die Korrektur.
Ich hätte jetzt lediglich das Problem, dass sich die Intensität an den Kreisen addiert. Besteht eine Möglichkeit dies zu verhindern?
\begin{tikzpicture}[
    >=Stealth,
    scale=1.0,
font=\sffamily,
    colored ball/.style={draw, circle, ball color=#1, minimum width=0.6cm},
    colored ball/.default=yellow
]
\node [colored ball=red,opacity=0.5] (+++) at (1,1,1) {y$_1$};
\node [colored ball=red,opacity=0.5] (++-) at (1,1,-1) {y$_2$};
\node [colored ball=red,opacity=0.5] (+-+) at (1,-1,1) {y$_3$};
\node [colored ball=red,opacity=0.5] (+--) at (1,-1,-1) {y$_4$};
\node [colored ball=blue,opacity=0.5] (-++) at (-1,1,1) {y$_5$};
\node [colored ball=blue,opacity=0.5] (-+-) at (-1,1,-1) {y$_6$};
\node [colored ball=blue,opacity=0.5] (--+) at (-1,-1,1) {y$_7$};
\node [colored ball=blue,opacity=0.5] (---) at (-1,-1,-1) {y$_8$};
%\newcommand*\kante{1}
%Kanten
\draw%[font=\normalsize]
  (-++) -- (--+)
  (--+) -- (+-+)
  (-++) -- (+++)
  (+++) -- (+-+)
  (-++) -- (-+-)
  (+++) -- (++-)
  (+-+) -- (+--)
  (+--) -- (++-)
  (-+-) -- (++-)
;
\draw[dashed, very thin]
    (--+) -- (---)
    (---) -- (+--)
    (---) -- (-+-);
\fill[red,opacity=0.3] (+++.center) -- (++-.center) -- (+--.center) -- (+-+.center);
\fill[blue,opacity=0.3] (-++.center) -- (-+-.center) -- (---.center) -- (--+.center);
\end{tikzpicture}-
nils_trash@hotmail.com
- Forum-Anfänger
- Beiträge: 10
- Registriert: Do 18. Okt 2018, 11:03
Besonders deutlich ist es in diesem Fall:
\begin{tikzpicture}[
    >=Stealth,
    scale=1.0,
font=\sffamily,
    colored ball/.style={draw, circle, ball color=#1, minimum width=0.5cm},
    colored ball/.default=yellow
]
\node [colored ball=red,opacity=0.5] (+++) at (1,1,1) {y$_1$};
\node [colored ball=blue,opacity=0.5] (++-) at (1,1,-1) {y$_2$};
\node [colored ball=red,opacity=0.5] (+-+) at (1,-1,1) {y$_3$};
\node [colored ball=blue,opacity=0.5] (+--) at (1,-1,-1) {y$_4$};
\node [colored ball=red,opacity=0.5] (-++) at (-1,1,1) {y$_5$};
\node [colored ball=blue,opacity=0.5] (-+-) at (-1,1,-1) {y$_6$};
\node [colored ball=red,opacity=0.5] (--+) at (-1,-1,1) {y$_7$};
\node [colored ball=blue,opacity=0.5] (---) at (-1,-1,-1) {y$_8$};
%\newcommand*\kante{1}
%Kanten
\draw%[font=\normalsize]
  (-++) -- (--+)
  (--+) -- (+-+)
  (-++) -- (+++)
  (+++) -- (+-+)
  (-++) -- (-+-)
  (+++) -- (++-)
  (+-+) -- (+--)
  (+--) -- (++-)
  (-+-) -- (++-)
;
\draw[dashed, very thin]
    (--+) -- (---)
    (---) -- (+--)
    (---) -- (-+-);
\fill[red,opacity=0.3] (+++.center) -- (+-+.center) -- (--+.center) -- (-++.center);
\fill[blue,opacity=0.3] (++-.center) -- (+--.center) -- (---.center) -- (-+-.center);
\end{tikzpicture}Mir ist nicht klar, wie die Markierung der Ecken aussehen soll.
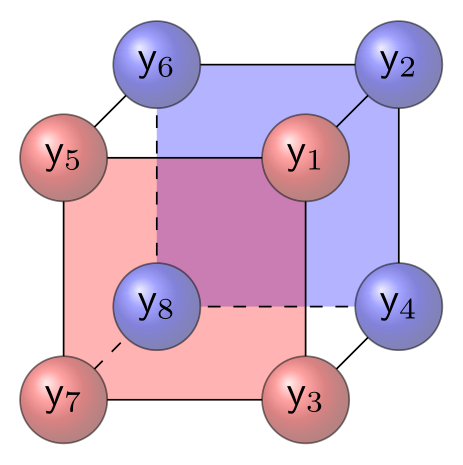
Wenn die Ecken dann doch etwas durchsichtig sein sollen, dann kannst Du opacity in der preaction etwas anpassen, zum Beispiel
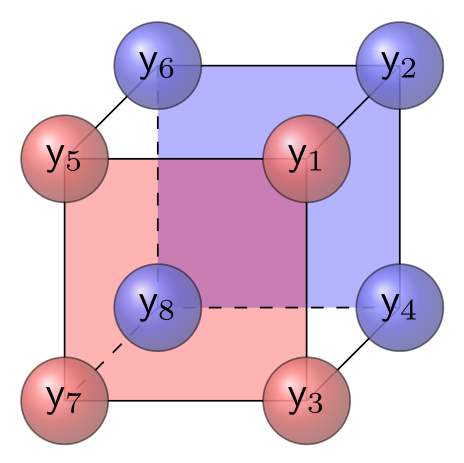
\documentclass[margin=5pt]{standalone}
\usepackage{tikz}
\usetikzlibrary{arrows.meta}
\begin{document}
\begin{tikzpicture}[
    >=Stealth,
    font=\sffamily,
    colored ball/.style={draw, circle, ball color=#1, minimum width=0.5cm},
    colored ball/.default=yellow
]
% Koordinaten
\path%[scale=3]
  foreach \x/\y/\z in
    {+/+/+, +/-/+, -/+/+, -/-/+, +/+/-, +/-/-, -/+/-, -/-/-}
    {(\x1,\y1,\z1) coordinate (\x\y\z)}
;
% Flächen
\begin{scope}[opacity=0.3]
  \fill[blue] (++-) -- (+--) -- (---) -- (-+-) -- cycle;
  \fill[red]  (+++) -- (+-+) -- (--+) -- (-++) -- cycle;
\end{scope}

%Kanten
\path
  (-++) edge (+++) edge (--+) edge (-+-)
  (++-) edge (-+-) edge (+--) edge (+++)
  (+-+) edge (--+) edge (+++) edge (+--)
;
\path [dashed,thin]
  (---) edge (+--) edge (-+-) edge (--+)
;
% Ecken
\path
  foreach[count=\i] \c/\ballcolor in
    {+++/red, ++-/blue, +-+/red, +--/blue, -++/red, -+-/blue, --+/red, ---/blue}
    {(\c)node
      [preaction={fill=white, opacity=1}]
      [colored ball=\ballcolor, opacity=.5, text opacity=1]
      (y\i)
      {y$_\i$}
    }
;
\end{tikzpicture}
\end{document}
Wenn die Ecken dann doch etwas durchsichtig sein sollen, dann kannst Du opacity in der preaction etwas anpassen, zum Beispiel
[preaction={fill=white, opacity=.75}]- Dateianhänge
-
- gl_wuerfel2.png (70 KiB) 3345 mal betrachtet
-
- gl_wuerfel1.png (50.66 KiB) 3309 mal betrachtet
-
nils_trash@hotmail.com
- Forum-Anfänger
- Beiträge: 10
- Registriert: Do 18. Okt 2018, 11:03
Vielen Dank, es passt perfekt.
Ich sitze aktuell noch an der Unterschrift (wollte 3 Würfel nebeneinander setzen)
Wenn ich das ganze über minipage realisiere stimmen zwar die Abstände, jedoch bekomme ich eine Fehlermeldung wenn ich eine Unterschrift über caption einfügen möchte.
Wenn ich das ganze über subfigure realisiere passen zwar die Bildunterschriften, jedoch sind die 3 Würfel nicht gleichmäßig verteilt. Gibt es hierfür einen Lösungsvorschlag?
\begin{figure}[h!]
    \subfigure[Unterschrift links]{\begin{tikzpicture}[
    >=Stealth,
    font=\sffamily,
    colored ball/.style={draw, circle, ball color=#1, minimum width=0.5cm},
    colored ball/.default=yellow
]
% Koordinaten
\path%[scale=3]
  foreach \x/\y/\z in
    {+/+/+, +/-/+, -/+/+, -/-/+, +/+/-, +/-/-, -/+/-, -/-/-}
    {(\x1,\y1,\z1) coordinate (\x\y\z)}
;
% Flächen
\begin{scope}[opacity=0.3]
  \fill[blue] (-++) -- (-+-) -- (---) -- (--+) -- cycle;
  \fill[red]  (+++) -- (++-) -- (+--) -- (+-+) -- cycle;
\end{scope}

%Kanten
\path
  (-++) edge (+++) edge (--+) edge (-+-)
  (++-) edge (-+-) edge (+--) edge (+++)
  (+-+) edge (--+) edge (+++) edge (+--)
;
\path [dashed,thin]
  (---) edge (+--) edge (-+-) edge (--+)
;
% Ecken
\path
  foreach[count=\i] \c/\ballcolor in
    {+++/red, ++-/red, +-+/red, +--/red, -++/blue, -+-/blue, --+/blue}
    {(\c)node
      [preaction={fill=white, opacity=1}]
      [colored ball=\ballcolor, opacity=.5, text opacity=1]
      (y\i)
      {y$_\i$}
    }
;
\path
  foreach[count=\i] \c/\ballcolor in
    {---/blue}
    {(\c)node
      [preaction={fill=white, opacity=0.75}]
      [colored ball=\ballcolor, opacity=.5, text opacity=1]
      (y\i)
      {y$_8$}
    }
;
\end{tikzpicture}}
    \subfigure[Unterschrift mitte]{\begin{tikzpicture}[
    >=Stealth,
    font=\sffamily,
    colored ball/.style={draw, circle, ball color=#1, minimum width=0.5cm},
    colored ball/.default=yellow
]
% Koordinaten
\path%[scale=3]
  foreach \x/\y/\z in
    {+/+/+, +/-/+, -/+/+, -/-/+, +/+/-, +/-/-, -/+/-, -/-/-}
    {(\x1,\y1,\z1) coordinate (\x\y\z)}
;
% Flächen
\begin{scope}[opacity=0.3]
  \fill[blue] (+-+) -- (+--) -- (---) -- (--+) -- cycle;
  \fill[red]  (+++) -- (++-) -- (-+-) -- (-++) -- cycle;
\end{scope}

%Kanten
\path
  (-++) edge (+++) edge (--+) edge (-+-)
  (++-) edge (-+-) edge (+--) edge (+++)
  (+-+) edge (--+) edge (+++) edge (+--)
;
\path [dashed,thin]
  (---) edge (+--) edge (-+-) edge (--+)
;
% Ecken
\path
  foreach[count=\i] \c/\ballcolor in
    {+++/red, ++-/red, +-+/blue, +--/blue, -++/red, -+-/red, --+/blue}
    {(\c)node
      [preaction={fill=white, opacity=1}]
      [colored ball=\ballcolor, opacity=.5, text opacity=1]
      (y\i)
      {y$_\i$}
    }
;
\path
  foreach[count=\i] \c/\ballcolor in
    {---/blue}
    {(\c)node
      [preaction={fill=white, opacity=0.75}]
      [colored ball=\ballcolor, opacity=.5, text opacity=1]
      (y\i)
      {y$_8$}
    }
;
\end{tikzpicture}}
    \subfigure[Unterschrift rechts]{\begin{tikzpicture}[
    >=Stealth,
    font=\sffamily,
    colored ball/.style={draw, circle, ball color=#1, minimum width=0.5cm},
    colored ball/.default=yellow
]
% Koordinaten
\path%[scale=3]
  foreach \x/\y/\z in
    {+/+/+, +/-/+, -/+/+, -/-/+, +/+/-, +/-/-, -/+/-, -/-/-}
    {(\x1,\y1,\z1) coordinate (\x\y\z)}
;
% Flächen
\begin{scope}[opacity=0.3]
  \fill[blue] (++-) -- (+--) -- (---) -- (-+-) -- cycle;
  \fill[red]  (+++) -- (+-+) -- (--+) -- (-++) -- cycle;
\end{scope}

%Kanten
\path
  (-++) edge (+++) edge (--+) edge (-+-)
  (++-) edge (-+-) edge (+--) edge (+++)
  (+-+) edge (--+) edge (+++) edge (+--)
;
\path [dashed,thin]
  (---) edge (+--) edge (-+-) edge (--+)
;
% Ecken
\path
  foreach[count=\i] \c/\ballcolor in
    {+++/red, ++-/blue, +-+/red, +--/blue, -++/red, -+-/blue, --+/red}
    {(\c)node
      [preaction={fill=white, opacity=1}]
      [colored ball=\ballcolor, opacity=.5, text opacity=1]
      (y\i)
      {y$_\i$}
    }
;
\path
  foreach[count=\i] \c/\ballcolor in
    {---/blue}
    {(\c)node
      [preaction={fill=white, opacity=0.75}]
      [colored ball=\ballcolor, opacity=.5, text opacity=1]
      (y\i)
      {y$_8$}
    }
;
\end{tikzpicture}}
\caption{Bildunterschrift unter alle}
\label{Verlinkung}
\end{figure}Das ist im Grunde ein neues Thema.
Anstelle des veralteten subfigure kannst Du auch subcaption nehmen. Ersetze \subfigure durch \subcaptionbox und richte den Inhalt der figure-Umgebung mittig aus.
Die gemeinsamen Optionen der drei tikzpicture-Umgebungen dürfen mit der Hilfe des Befehls \tikzset am Anfang der figure-Umgebung stehen.
Anstelle des veralteten subfigure kannst Du auch subcaption nehmen. Ersetze \subfigure durch \subcaptionbox und richte den Inhalt der figure-Umgebung mittig aus.
Die gemeinsamen Optionen der drei tikzpicture-Umgebungen dürfen mit der Hilfe des Befehls \tikzset am Anfang der figure-Umgebung stehen.