Quadratische Funktion plotten
Verfasst: Mi 10. Apr 2019, 19:57
Hallo,
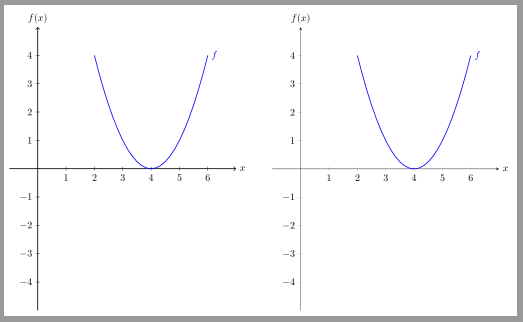
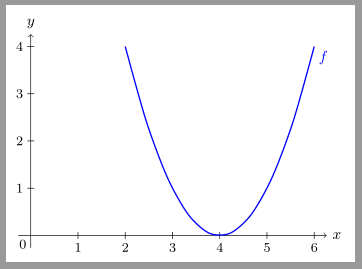
ich bin Neuling, was LaTeX angeht und habe ein Problem mit dem Plotten einer quadratischen Funktion. Die Funktionsgleichung lautet: f(x)=(x-4)². Ich habe schon etwas rumprobiert, jedoch ist das Ergebnis immer komisch. Das Koordinatensystem ist unten, oder die Parabel ist außerhalb des Koordinatensystems.
Ich bedanke mich im Voraus schon für eure Hilfe. Smile
\begin{tikzpicture}

%Nummerierung
\foreach \x in {-1,1,2,3,4,5}
\draw [xshift=\x cm] (0,2pt) -- (0,-2pt)
node [below,] {$\x$};

\foreach \y in {-5,-4,-3,-2,-1,1,2,3,4,5}
\draw [yshift=\y cm] (2pt, 0) -- (-2pt,0)
node [left, ] {$\y$};

%Achsen
\draw [->, thick] (-1,0) -- (5,0) node[right] {$x$};
\draw [->, thick] (0, -5) -- (0,5) node[above] {$f(x)$};

%f
\draw [color=blue, thick, domain=-1:1] plot (\x,{((\x)-4)^2}) node[right] {$f$};

\end{tikzpicture}