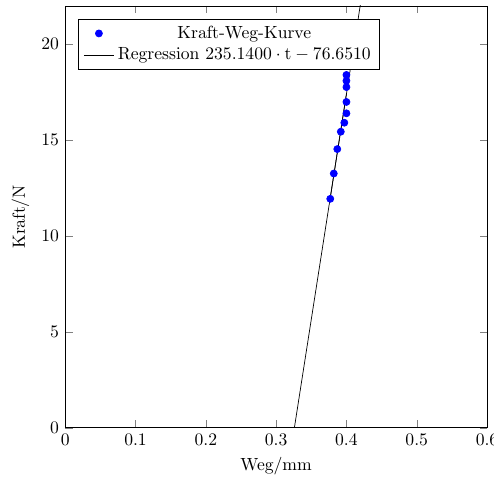
ich habe eine lineare Regression erstellt und würde nun gerne die Nullstelle markieren lassen. Ich könnte das Ganze natürlich ausrechnen und dann mit
extra x ticks={x1}pgfplotstableregressiona
pgfplotstableregressionb
Kann mir da von euch vielleicht jemand helfen?
Schon mal vielen Dank,
Simande
\documentclass{article}
\usepackage{pgfplots}
\pgfplotsset{%
    ,compat=1.12
    ,every axis legend/.append style={%
        ,at={(0.03,0.97)}
        ,anchor=north west}
        }
\usepackage{pgfplotstable}

\begin{document}
\begin{tikzpicture}
    \begin{axis}[%
        ,width=10cm,height=10cm
        ,x tick label style={/pgf/number format/1000 sep=}
        ,xmin=0,xmax=0.6
        ,ymin=0,ymax=22
        ,xlabel=Weg/mm,
        ,ylabel=Kraft/N,
        ]
        \addplot+[%
            ,fill = blue
            ,mark = *
            ,mark options={solid}
            ,only marks
            ] table {%
                x       y
                0.400   18.096
                0.400   18.401
                0.400   17.767
                0.400   16.992
                0.400   16.399
                0.397   15.908
                0.392   15.440
                0.387   14.533
                0.382   13.258
                0.377   11.939
                };
        \addlegendentry{Kraft-Weg-Kurve}
        \addplot [] table [%
            ,y={create col/linear regression}] {%
                x       y
                0.400   18.096
                0.400   18.401
                0.400   17.767
                0.400   16.992
                0.400   16.399
                0.397   15.908
                0.392   15.440
                0.387   14.533
                0.382   13.258
                0.377   11.939
                };
        \addplot [draw,domain=0.25:0.5] (x,\pgfplotstableregressiona*x+\pgfplotstableregressionb);
        \addlegendentry{Regression {$\pgfmathprintnumber[precision=4, fixed zerofill]{\pgfplotstableregressiona} \cdot \mathrm{t} \pgfmathprintnumber[precision=4, fixed zerofill]{\pgfplotstableregressionb}$}}
    \end{axis}
\end{tikzpicture}
\end{document}