Linienversatz innerhalb einer Zeichnung

Tabellen und Grafiken erstellen und anordnen


Patrick1990
Forum-Century
Forum-Century
Beiträge: 208
Registriert: Mo 18. Feb 2013, 07:56
Wohnort: Ilmenau

Linienversatz innerhalb einer Zeichnung

Beitrag von Patrick1990 »

Hallo,
ich habe folgendes Problem:
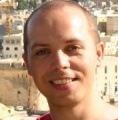
Ich versuche einzelne Kontursegmente zu einem Kreis zusammenzufügen. Die Anzahl der Segmente ist im Parameter N hinterlegt. Bei kleinen N funktioniert alles wie es soll, jedoch habe ich bei größeren N (hier 36) einen Versatz in der Zeichnung. Woher kommt das und wie kann ich es beheben?


Hier das Beispiel:
\documentclass{standalone}
\usepackage{tikz}
\usetikzlibrary{fpu, calc, angles, intersections} 
\usepackage{pgfplots}
\pgfplotsset{compat=1.18}
\usepackage{comment}

\newcommand{\radiusOHL}[3]{
\path 
(#1)coordinate(M)% Mittelpunkt 
(#2)coordinate(A)% Anfangskoordinate 
(#3)coordinate(B)% Endkoordinate 
; 
\path 
let 
\p1=(M), \p2=(A), 
\n1={veclen({\x2-\x1},{\y2-\y1})} 
in 
pic[draw=black,angle radius=\n1]{angle=A--M--B} ; 
}


\begin{document}
\begin{tikzpicture}
% Parameter
\def\N{36}
\def\rot{90-360/\N}
\def\bzhs{0.3}
\def\nutoeffnung{0.8}
\def\do{10}
\def\di{7}
\def\hzhs{0.4}
\def\hrues{0.4}
\def\hzks{0.1}

\def\p{2}
\def\delta{0.2}
\def\alphap{0.5}
\def\dw{1}

\def\rotorcolor{gray!50}
\def\statorcolor{gray}

% Berechnungen
\def\taupdeg{360/(2*\p)}
\def\tauNdeg{360/\N}
\pgfmathsetmacro\dzk{\di+\hzks*(\do-\di)};
\pgfmathsetmacro\drue{\do-\hrues*(\do-\di)};
\pgfmathsetmacro\dzhu{\do-(\hrues+\hzhs)*(\do-\di)};
\pgfmathsetmacro\dro{\di-2*\delta};


% Hilfslinien
\path[color=gray,dashed, name path=DAS] (0,0)++(\rot:\do/2) arc(\rot:\rot+2*360/\N:\do/2);% node {\tiny DAS};
\path[color=gray,dashed, name path=DIS] (0,0)++(\rot:\di/2) arc(\rot:\rot+2*360/\N:\di/2);% node {\tiny DIS};
\path[color=gray,dashed, name path=DRUE] (0,0)++(\rot:\drue/2) arc(\rot:\rot+2*360/\N:\drue/2);% node {\tiny DRUE};
\path[color=gray,dashed, name path=DZK] (0,0)++(\rot:\dzk/2) arc(\rot:\rot+2*360/\N:\dzk/2);% node {\tiny DZK};
\path[color=gray,dashed,name path=GL] (0,0) -- (0, 1.1*\do/2);% node[above] {\tiny GL};
\path[color=gray,dashed,name path=GZ] (0,0) -- ({1.1*\do/2*sin(\nutoeffnung*360/(2*\N))}, {1.1*\do/2*cos(\nutoeffnung*360/(2*\N))});% node[above] {\tiny GZ};
\path[color=gray,dashed,name path=GR] (0,0) -- ({1.1*\do/2*sin(360/(2*\N))}, {1.1*\do/2*cos(360/(2*\N))});% node[above] {\tiny GR};

% Schnittpunkte & Koordinaten
\path[name intersections={of=GL and DIS}](intersection-1) coordinate (c1);% node {\tiny 1};  
\path[name intersections={of=GZ and DIS}](intersection-1) coordinate (c2);% node {\tiny 2};  
\path[name intersections={of=GZ and DZK}](intersection-1) coordinate (c3);% node {\tiny 3};  
\path (c3);
\pgfgetlastxy{\xa}{\ya};
\pgfmathsetmacro\bzh{2*\bzhs*\xa};
\path[name path=BZH] ({\bzh/2 pt},0) -- ({\bzh/2 pt},1.1*\drue/2);
\path ({\bzh/2 pt},\dzhu/2) coordinate (c4);% node{\tiny 4};% node{\tiny 5};
\path[name intersections={of=BZH and DRUE}](intersection-1) coordinate (c5);% node {\tiny 5};  
\path[name intersections={of=GR and DRUE}](intersection-1) coordinate (c6);% node {\tiny 6};  
\path[name intersections={of=GR and DAS}] (intersection-1) coordinate (c7);% node {\tiny 7};
\path[name intersections={of=GL and DAS}](intersection-1) coordinate (c8);% node {\tiny 8};  
\path[name path=HLW] (c3) -- (c4);


% Spiegelung
\foreach \x in {2,3,4,5,6,7,8} {
\path (c\x);
\pgfgetlastxy{\xc}{\yc};
\path (-\xc, \yc) coordinate (c\x m);% node{\tiny \x m};
}  


% Koordinatendrehung STATOR

%xr1s = x*cos phi+y*sin phi
%yr1s = -x*sin phi + y*cos phi

\pgfmathsetmacro\k{\N-1}
%\foreach \i in {0,1,2,...,\k} {
\foreach \i in {0,1,2,3,4,5} {

\pgfmathsetmacro\phirot{\i*\tauNdeg}

\foreach \x in {2,3,4,5,6,7,8} {
\path (c\x);
\pgfgetlastxy{\xc}{\yc};
\path ({\xc * cos(\phirot)+\yc * sin(\phirot)}, {-\xc * sin(\phirot)+\yc * cos(\phirot)}) coordinate (c\x rot);% node[above]{\scalebox{.2}{r\x rot}};

\path (c\x m);
\pgfgetlastxy{\xc}{\yc};
\path ({\xc * cos(\phirot)+\yc * sin(\phirot)}, {-\xc * sin(\phirot)+\yc * cos(\phirot)}) coordinate (c\x mrot);% node[above]{\scalebox{.2}{r\x mrot}};
} 

% Kontur
\radiusOHL{{0,0}}{c7rot}{c7mrot};
\radiusOHL{{0,0}}{c6rot}{c5rot};
\draw (c5rot) -- (c4rot); 
\draw (c4rot) -- (c3rot); 
\draw (c3rot) -- (c2rot); 
\radiusOHL{{0,0}}{c2rot}{c2mrot};
\draw (c2mrot) -- (c3mrot); 
\draw (c3mrot) -- (c4mrot); 
\draw (c4mrot) -- (c5mrot); 
\radiusOHL{{0,0}}{c5mrot}{c6mrot};

};
\end{tikzpicture}
\end{document}

Dateianhänge
Bildschirmfoto 2023-11-30 um 16.18.44.png

Stammgast

Re: Linienversatz innerhalb einer Zeichnung

Beitrag von Stammgast »

Die Ursache liegt nicht unbedingt beim TeX-System. Welcher PDF-Betrachter wird hier benutzt? Da ist dann möglicherweise ein Wechsel in Betracht zu ziehen.

Patrick1990
Forum-Century
Forum-Century
Beiträge: 208
Registriert: Mo 18. Feb 2013, 07:56
Wohnort: Ilmenau

Re: Linienversatz innerhalb einer Zeichnung

Beitrag von Patrick1990 »

Das war auch mein erster Gedanke, ich habe das im Overleaf und im TeXworks getestet. Das Ergebnis bleibt leider gleich.
Was kann es noch sein?

Stammgast

Re: Linienversatz innerhalb einer Zeichnung

Beitrag von Stammgast »

Nun, das sind für das Auffinden einer möglichen Ursache viel zu wenig Testobjekte. Als Editoren mit integriertem PDF-Betrachter wären da beispielsweise noch TeXmaker und TeXstudio. Nur für Wind0ws als reinen PDF-Betrachter gibt es noch Sumatra PDF (welcher geöffnete Dateien nicht blockiert und noch sehr viele andere Formate lesen kann). Das sind insgesamt aber möglicherweise immer noch zu wenig am Test Beteiligte. Die Vergrößerung im Betrachter spielt auch noch eine Rolle. Und letztendlich kann ein Testausdruck noch Aufschluss über das Ergebnis auf Papier geben.

Benutzeravatar
Stefan Kottwitz
Admin
Admin
Beiträge: 2534
Registriert: Di 8. Jul 2008, 00:39
Kontaktdaten:

Re: Linienversatz innerhalb einer Zeichnung

Beitrag von Stefan Kottwitz »

Im Browser PDF-Plugin, hier im Webbrowser, sieht es auch so aus, wenn ich hier auf "LaTeX-Ausgabe" klicke. Im Acrobat Reader auch. Analysiert habe ich es allerdings nicht.

Für wiederholte Ausgaben bietet sich das "pic"-Feature an. pic-Beispiele aus meinem TikZ-Buch sind hier: Chapter 5 – Using styles and pics.

Stefan

Patrick1990
Forum-Century
Forum-Century
Beiträge: 208
Registriert: Mo 18. Feb 2013, 07:56
Wohnort: Ilmenau

Re: Linienversatz innerhalb einer Zeichnung

Beitrag von Patrick1990 »

Gleiches Phänoment im Sumatra und bei einem Testausdruck.
Komischerweise funktioniert es ja für kleinere "N".

Patrick1990
Forum-Century
Forum-Century
Beiträge: 208
Registriert: Mo 18. Feb 2013, 07:56
Wohnort: Ilmenau

Re: Linienversatz innerhalb einer Zeichnung

Beitrag von Patrick1990 »

Stefan Kottwitz hat geschrieben:
So 3. Dez 2023, 14:46
Für wiederholte Ausgaben bietet sich das "pic"-Feature an. pic-Beispiele aus meinem TikZ-Buch sind hier: Chapter 5 – Using styles and pics.

Stefan
Danke, das schaue ich mir mal an.

Patrick1990
Forum-Century
Forum-Century
Beiträge: 208
Registriert: Mo 18. Feb 2013, 07:56
Wohnort: Ilmenau

Re: Linienversatz innerhalb einer Zeichnung

Beitrag von Patrick1990 »

Hier mit pic. Ich musste einiges ändern. Scheinbar klappt pic in Verbindung mit meinen vorherigen Koordinatenberechnungen über pgfmathsetmacro nicht so.
Für mich sieht es so aus, als läge da eine Berechnungsungenauigkeit vor bei meinen Radien.
Diese werden mittels \radiusOHL berechnet. Kann man die Genauigkeit erhöhen?


\documentclass{standalone}
\usepackage{tikz}
\usetikzlibrary{fpu, calc, angles, intersections, positioning, spy} 
\usepackage{pgfplots}
\pgfplotsset{compat=1.18}
\usepackage{comment}
\usepackage{tkz-euclide}


\newcommand{\radiusOHL}[3]{
\path 
(#1)coordinate(M)% Mittelpunkt 
(#2)coordinate(A)% Anfangskoordinate 
(#3)coordinate(B)% Endkoordinate 
; 
\path 
let 
\p1=(M), \p2=(A), 
\n1={veclen({\x2-\x1},{\y2-\y1})} 
in 
pic[draw=black,angle radius=\n1]{angle=A--M--B} ; 
}

\tikzset{zahn/.pic={
% Parameter
\def\N{36}
\def\rot{90-360/\N}
\def\bzhs{0.3}
\def\nutoeffnung{0.8}
\def\do{10}
\def\di{7}
\def\hzhs{0.4}
\def\hrues{0.4}
\def\hzks{0.1}

\def\p{2}
\def\delta{0.2}
\def\alphap{0.5}
\def\dw{1}

\def\rotorcolor{gray!50}
\def\statorcolor{gray}

% Berechnungen
\def\taupdeg{360/(2*\p)}
\def\tauNdeg{360/\N}
\pgfmathsetmacro\dzk{\di+\hzks*(\do-\di)};
\pgfmathsetmacro\drue{\do-\hrues*(\do-\di)};
\pgfmathsetmacro\dzhu{\do-(\hrues+\hzhs)*(\do-\di)};
\pgfmathsetmacro\dro{\di-2*\delta};


% Hilfslinien
\path[color=gray,dashed, name path=DAS] (0,0)++(\rot:\do/2) arc(\rot:\rot+2*360/\N:\do/2);% node {\tiny DAS};
\path[color=gray,dashed, name path=DIS] (0,0)++(\rot:\di/2) arc(\rot:\rot+2*360/\N:\di/2);% node {\tiny DIS};
\path[color=gray,dashed, name path=DRUE] (0,0)++(\rot:\drue/2) arc(\rot:\rot+2*360/\N:\drue/2);% node {\tiny DRUE};
\path[color=gray,dashed, name path=DZK] (0,0)++(\rot:\dzk/2) arc(\rot:\rot+2*360/\N:\dzk/2);% node {\tiny DZK};
\path[color=gray,dashed,name path=GL] (0,0) -- (0, 1.1*\do/2);% node[above] {\tiny GL};
\path[color=gray,dashed,name path=GZ] (0,0) -- ({1.1*\do/2*sin(\nutoeffnung*360/(2*\N))}, {1.1*\do/2*cos(\nutoeffnung*360/(2*\N))});% node[above] {\tiny GZ};
\path[color=gray,dashed,name path=GR] (0,0) -- ({1.1*\do/2*sin(360/(2*\N))}, {1.1*\do/2*cos(360/(2*\N))});% node[above] {\tiny GR};

% Schnittpunkte & Koordinaten
\path[name intersections={of=GL and DIS}](intersection-1) coordinate (c1);% node {\tiny 1};  
\path[name intersections={of=GZ and DIS}](intersection-1) coordinate (c2);% node {\tiny 2};  
\path[name intersections={of=GZ and DZK}](intersection-1) coordinate (c3);% node {\tiny 3};  
\path[green] (c3) -- (0, |- c3) coordinate (ch34);
\path[green] (ch34) -- ($(ch34)!\bzhs!(c3)$) coordinate (chh34); 
\path (chh34) -- (chh34 |-,\dzhu/2) coordinate (c4);
\path[name path=BZH, color=blue] (chh34) -- (chh34 |-,\do/2);
\path[name intersections={of=BZH and DRUE}](intersection-1) coordinate (c5);% node {\tiny 5};  
\path[name intersections={of=GR and DRUE}](intersection-1) coordinate (c6);% node {\tiny 6};  
\path[name intersections={of=GR and DAS}] (intersection-1) coordinate (c7);% node {\tiny 7};
\path[name intersections={of=GL and DAS}](intersection-1) coordinate (c8);% node {\tiny 8};  
\path[name path=HLW] (c3) -- (c4);
\path (0,0) coordinate (D) -- (0,1.1*\do/2) coordinate (E);

% Spiegelung
\foreach \x in {2,3,4,5,6,7} {
%\path (c\x);
%\pgfgetlastxy{\xc}{\yc};
%\path (-\xc, \yc) coordinate (c\x m);% node{\tiny \x m};
\tkzDefPointBy[reflection=over D--E](c\x) \tkzGetPoint{c\x m};
}; 

% Füllung
\begin{scope}[even odd rule]
\clip circle(\do/2)  circle(\drue/2) circle(\dzk/2) circle(\di/2);
\fill[\statorcolor, opacity=1] (c2m) -- (c2) -- (c3) -- (c4) -- (c5) -- (c6) -- (c7) -- ($(c7)!0.5!-45:(c8)$) -- (c8) -- ($(c8)!0.5!-45:(c7m)$) -- (c7m) -- (c6m) -- (c5m) -- (c4m) -- (c3m);
\end{scope}
\begin{scope}[even odd rule]
\clip circle(\drue/2)  circle(\dzk/2);
\fill[\statorcolor, opacity=1] (c2m) -- (c2) -- (c3) -- (c4) -- (c5) -- ($(c5)!0.5!-45:(c5m)$) -- (c5m) -- (c4m) -- (c3m);
\end{scope}

% Kontur
\radiusOHL{{0,0}}{c7}{c7m};
\radiusOHL{{0,0}}{c6}{c5};
\draw (c5) -- (c4); 
\draw (c4) -- (c3); 
\draw (c3) -- (c2); 
\radiusOHL{{0,0}}{c2}{c2m};
\draw (c2m) -- (c3m); 
\draw (c3m) -- (c4m); 
\draw (c4m) -- (c5m); 
\radiusOHL{{0,0}}{c5m}{c6m};


% WICKLUNG

% Hilfslinien
\path[color=gray,dashed,name path=GW] (0,0) -- ({1.1*\do/2*sin(0.8*\nutoeffnung*360/(2*\N))}, {1.1*\do/2*cos(0.8*\nutoeffnung*360/(2*\N))});% node[above] {\tiny GZ};

% Koordinaten
\path[name intersections={of=GW and HLW}](intersection-1) coordinate (cw1);% node {\tiny w1}; 
\path[name intersections={of=GW and DRUE}](intersection-1) coordinate (cw2);% node {\tiny w2}; 

\path (cw1);
\pgfgetlastxy{\xc}{\yc};
\path (-\xc, \yc) coordinate (cw4);
\path (cw1);
\pgfgetlastxy{\xc}{\yc};
\pgfmathsetmacro\rtemp{sqrt(\xc^2+\yc^2)}
\pgfmathsetmacro\dcoil{2*\rtemp}
\path (cw2);
\pgfgetlastxy{\xc}{\yc};
\path (-\xc, \yc) coordinate (cw3);

% Spiegelung
\foreach \x in {1,2} {
\tkzDefPointBy[reflection=over D--E](cw\x) \tkzGetPoint{cw\x m};
}; 

% Füllung
\begin{scope}[even odd rule]
\clip circle(\drue/2) circle(\dcoil pt/2);
\fill[orange, opacity=0.75] (cw1) -- (cw2) -- ($(cw2)!0.5!-45:(c5)$) -- (c5) -- (c4);
\end{scope}
\begin{scope}[even odd rule]
\clip circle(\drue/2) circle(\dcoil pt/2);
\fill[orange, opacity=0.75] (cw1m) -- (cw2m) -- ($(cw2m)!0.5!45:(c5m)$) -- (c5m) -- (c4m);
\end{scope}

% Kontur
%rechts
\draw[] (cw1) -- (cw2);
\radiusOHL{{0,0}}{cw2}{c5}
\draw[] (c5) -- (c4) -- (cw1);
%links
\draw[] (cw1m) -- (cw2m);
\radiusOHL{{0,0}}{c5m}{cw2m}
\draw[] (c5m) -- (c4m) -- (cw1m);
}}


\begin{document}
\begin{tikzpicture}[spy using outlines={circle, magnification=7, size=17mm, connect spies}]
\def\N{36}
\def\tauNdeg{360/\N}
\pgfmathsetmacro\k{\N-1}
\foreach \i in {0,1,2}{%,...,\k} {
\pgfmathsetmacro\phirot{\i*\tauNdeg}
\draw (0,0) pic[rotate=\phirot]{zahn};
};
\spy[red] on (c7) in node at (0,3);


\end{tikzpicture}
\end{document}

Antworten