Verfasst: Mo 20. Mai 2019, 01:14
Ein Teil meines erwähnten Beitrages handelt von Verbesserungen.
Wir helfen bei LaTeX-Fragen
https://golatex.de/
Du verbindest Knoten und nicht Koordinaten. Das gibt keine geschlossenen Kurven:nils_trash@hotmail.com hat geschrieben: Ich sitze aktuell daran einzelne Flächen einzufärben, hierfür wollte ich eigentlich
\draw[fill=yellow,opacity=0.6]
verwenden, jedoch bleibt die gewünschte Färbung der Fläche aus. Woran kann dies liegen, bzw. wie müsste ich den Code dafür anpassen?
\documentclass{article}
\usepackage{tikz}

\begin{document}
\begin{tikzpicture}[]
\node  (A) at (0,0) {A};
\node  (B) at (1,1) {B};
\node  (C) at (0,1) {C};
\filldraw[red](A)--(B)--(C)--(A);

\end{tikzpicture}

\begin{tikzpicture}[]
\node  (A) at (0,0) {A};
\node  (B) at (1,1) {B};
\node  (C) at (0,1) {C};
\filldraw[red](A.center)--(B.center)--(C.center)--cycle;
\end{tikzpicture}


\end{document}\begin{tikzpicture}[
>=Stealth,
scale=1.0,
font=\sffamily,
colored ball/.style={draw, circle, ball color=#1, minimum width=0.6cm},
colored ball/.default=yellow
]
\node [colored ball=red,opacity=0.5] (+++) at (1,1,1) {y$_1$};
\node [colored ball=red,opacity=0.5] (++-) at (1,1,-1) {y$_2$};
\node [colored ball=red,opacity=0.5] (+-+) at (1,-1,1) {y$_3$};
\node [colored ball=red,opacity=0.5] (+--) at (1,-1,-1) {y$_4$};
\node [colored ball=blue,opacity=0.5] (-++) at (-1,1,1) {y$_5$};
\node [colored ball=blue,opacity=0.5] (-+-) at (-1,1,-1) {y$_6$};
\node [colored ball=blue,opacity=0.5] (--+) at (-1,-1,1) {y$_7$};
\node [colored ball=blue,opacity=0.5] (---) at (-1,-1,-1) {y$_8$};
%\newcommand*\kante{1}
%Kanten
\draw%[font=\normalsize]
(-++) -- (--+)
(--+) -- (+-+)
(-++) -- (+++)
(+++) -- (+-+)
(-++) -- (-+-)
(+++) -- (++-)
(+-+) -- (+--)
(+--) -- (++-)
(-+-) -- (++-)
;
\draw[dashed, very thin]
(--+) -- (---)
(---) -- (+--)
(---) -- (-+-);
\fill[red,opacity=0.3] (+++.center) -- (++-.center) -- (+--.center) -- (+-+.center);
\fill[blue,opacity=0.3] (-++.center) -- (-+-.center) -- (---.center) -- (--+.center);
\end{tikzpicture}\begin{tikzpicture}[
>=Stealth,
scale=1.0,
font=\sffamily,
colored ball/.style={draw, circle, ball color=#1, minimum width=0.5cm},
colored ball/.default=yellow
]
\node [colored ball=red,opacity=0.5] (+++) at (1,1,1) {y$_1$};
\node [colored ball=blue,opacity=0.5] (++-) at (1,1,-1) {y$_2$};
\node [colored ball=red,opacity=0.5] (+-+) at (1,-1,1) {y$_3$};
\node [colored ball=blue,opacity=0.5] (+--) at (1,-1,-1) {y$_4$};
\node [colored ball=red,opacity=0.5] (-++) at (-1,1,1) {y$_5$};
\node [colored ball=blue,opacity=0.5] (-+-) at (-1,1,-1) {y$_6$};
\node [colored ball=red,opacity=0.5] (--+) at (-1,-1,1) {y$_7$};
\node [colored ball=blue,opacity=0.5] (---) at (-1,-1,-1) {y$_8$};
%\newcommand*\kante{1}
%Kanten
\draw%[font=\normalsize]
(-++) -- (--+)
(--+) -- (+-+)
(-++) -- (+++)
(+++) -- (+-+)
(-++) -- (-+-)
(+++) -- (++-)
(+-+) -- (+--)
(+--) -- (++-)
(-+-) -- (++-)
;
\draw[dashed, very thin]
(--+) -- (---)
(---) -- (+--)
(---) -- (-+-);
\fill[red,opacity=0.3] (+++.center) -- (+-+.center) -- (--+.center) -- (-++.center);
\fill[blue,opacity=0.3] (++-.center) -- (+--.center) -- (---.center) -- (-+-.center);
\end{tikzpicture}\documentclass[margin=5pt]{standalone}
\usepackage{tikz}
\usetikzlibrary{arrows.meta}
\begin{document}
\begin{tikzpicture}[
>=Stealth,
font=\sffamily,
colored ball/.style={draw, circle, ball color=#1, minimum width=0.5cm},
colored ball/.default=yellow
]
% Koordinaten
\path%[scale=3]
foreach \x/\y/\z in
{+/+/+, +/-/+, -/+/+, -/-/+, +/+/-, +/-/-, -/+/-, -/-/-}
{(\x1,\y1,\z1) coordinate (\x\y\z)}
;
% Flächen
\begin{scope}[opacity=0.3]
\fill[blue] (++-) -- (+--) -- (---) -- (-+-) -- cycle;
\fill[red] (+++) -- (+-+) -- (--+) -- (-++) -- cycle;
\end{scope}
%Kanten
\path
(-++) edge (+++) edge (--+) edge (-+-)
(++-) edge (-+-) edge (+--) edge (+++)
(+-+) edge (--+) edge (+++) edge (+--)
;
\path [dashed,thin]
(---) edge (+--) edge (-+-) edge (--+)
;
% Ecken
\path
foreach[count=\i] \c/\ballcolor in
{+++/red, ++-/blue, +-+/red, +--/blue, -++/red, -+-/blue, --+/red, ---/blue}
{(\c)node
[preaction={fill=white, opacity=1}]
[colored ball=\ballcolor, opacity=.5, text opacity=1]
(y\i)
{y$_\i$}
}
;
\end{tikzpicture}
\end{document}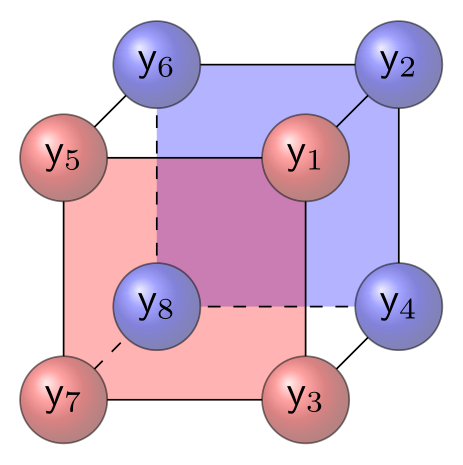
[preaction={fill=white, opacity=.75}]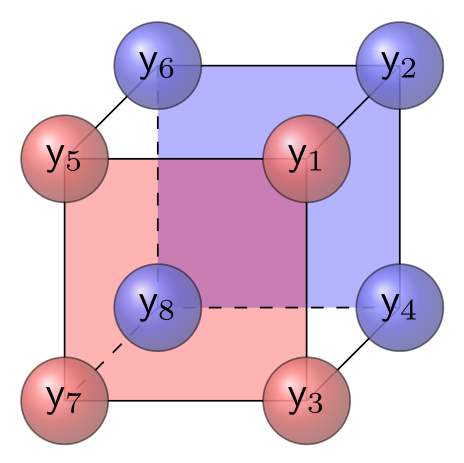
\begin{figure}[h!]
    \subfigure[Unterschrift links]{\begin{tikzpicture}[
    >=Stealth,
    font=\sffamily,
    colored ball/.style={draw, circle, ball color=#1, minimum width=0.5cm},
    colored ball/.default=yellow
]
% Koordinaten
\path%[scale=3]
  foreach \x/\y/\z in
    {+/+/+, +/-/+, -/+/+, -/-/+, +/+/-, +/-/-, -/+/-, -/-/-}
    {(\x1,\y1,\z1) coordinate (\x\y\z)}
;
% Flächen
\begin{scope}[opacity=0.3]
  \fill[blue] (-++) -- (-+-) -- (---) -- (--+) -- cycle;
  \fill[red]  (+++) -- (++-) -- (+--) -- (+-+) -- cycle;
\end{scope}

%Kanten
\path
  (-++) edge (+++) edge (--+) edge (-+-)
  (++-) edge (-+-) edge (+--) edge (+++)
  (+-+) edge (--+) edge (+++) edge (+--)
;
\path [dashed,thin]
  (---) edge (+--) edge (-+-) edge (--+)
;
% Ecken
\path
  foreach[count=\i] \c/\ballcolor in
    {+++/red, ++-/red, +-+/red, +--/red, -++/blue, -+-/blue, --+/blue}
    {(\c)node
      [preaction={fill=white, opacity=1}]
      [colored ball=\ballcolor, opacity=.5, text opacity=1]
      (y\i)
      {y$_\i$}
    }
;
\path
  foreach[count=\i] \c/\ballcolor in
    {---/blue}
    {(\c)node
      [preaction={fill=white, opacity=0.75}]
      [colored ball=\ballcolor, opacity=.5, text opacity=1]
      (y\i)
      {y$_8$}
    }
;
\end{tikzpicture}}
    \subfigure[Unterschrift mitte]{\begin{tikzpicture}[
    >=Stealth,
    font=\sffamily,
    colored ball/.style={draw, circle, ball color=#1, minimum width=0.5cm},
    colored ball/.default=yellow
]
% Koordinaten
\path%[scale=3]
  foreach \x/\y/\z in
    {+/+/+, +/-/+, -/+/+, -/-/+, +/+/-, +/-/-, -/+/-, -/-/-}
    {(\x1,\y1,\z1) coordinate (\x\y\z)}
;
% Flächen
\begin{scope}[opacity=0.3]
  \fill[blue] (+-+) -- (+--) -- (---) -- (--+) -- cycle;
  \fill[red]  (+++) -- (++-) -- (-+-) -- (-++) -- cycle;
\end{scope}

%Kanten
\path
  (-++) edge (+++) edge (--+) edge (-+-)
  (++-) edge (-+-) edge (+--) edge (+++)
  (+-+) edge (--+) edge (+++) edge (+--)
;
\path [dashed,thin]
  (---) edge (+--) edge (-+-) edge (--+)
;
% Ecken
\path
  foreach[count=\i] \c/\ballcolor in
    {+++/red, ++-/red, +-+/blue, +--/blue, -++/red, -+-/red, --+/blue}
    {(\c)node
      [preaction={fill=white, opacity=1}]
      [colored ball=\ballcolor, opacity=.5, text opacity=1]
      (y\i)
      {y$_\i$}
    }
;
\path
  foreach[count=\i] \c/\ballcolor in
    {---/blue}
    {(\c)node
      [preaction={fill=white, opacity=0.75}]
      [colored ball=\ballcolor, opacity=.5, text opacity=1]
      (y\i)
      {y$_8$}
    }
;
\end{tikzpicture}}
    \subfigure[Unterschrift rechts]{\begin{tikzpicture}[
    >=Stealth,
    font=\sffamily,
    colored ball/.style={draw, circle, ball color=#1, minimum width=0.5cm},
    colored ball/.default=yellow
]
% Koordinaten
\path%[scale=3]
  foreach \x/\y/\z in
    {+/+/+, +/-/+, -/+/+, -/-/+, +/+/-, +/-/-, -/+/-, -/-/-}
    {(\x1,\y1,\z1) coordinate (\x\y\z)}
;
% Flächen
\begin{scope}[opacity=0.3]
  \fill[blue] (++-) -- (+--) -- (---) -- (-+-) -- cycle;
  \fill[red]  (+++) -- (+-+) -- (--+) -- (-++) -- cycle;
\end{scope}

%Kanten
\path
  (-++) edge (+++) edge (--+) edge (-+-)
  (++-) edge (-+-) edge (+--) edge (+++)
  (+-+) edge (--+) edge (+++) edge (+--)
;
\path [dashed,thin]
  (---) edge (+--) edge (-+-) edge (--+)
;
% Ecken
\path
  foreach[count=\i] \c/\ballcolor in
    {+++/red, ++-/blue, +-+/red, +--/blue, -++/red, -+-/blue, --+/red}
    {(\c)node
      [preaction={fill=white, opacity=1}]
      [colored ball=\ballcolor, opacity=.5, text opacity=1]
      (y\i)
      {y$_\i$}
    }
;
\path
  foreach[count=\i] \c/\ballcolor in
    {---/blue}
    {(\c)node
      [preaction={fill=white, opacity=0.75}]
      [colored ball=\ballcolor, opacity=.5, text opacity=1]
      (y\i)
      {y$_8$}
    }
;
\end{tikzpicture}}
\caption{Bildunterschrift unter alle}
\label{Verlinkung}
\end{figure}