\documentclass[12pt]{article}
\usepackage[english]{babel}
\usepackage[utf8x]{inputenc}
\usepackage{amsmath}
\usepackage{tikz}
\usepackage{pgfplots}
\pgfplotsset{compat=1.12}

\begin{document}

\begin{tikzpicture}
	\begin{axis}[
		x tick label style={
			/pgf/number format/1000 sep=},
		symbolic x coords={Ohne,Sinus,Sprung},
		ylabel=$H_{MSE}$,
		enlargelimits=0.15,
		ybar,
		bar width=7pt,
		xtick={Ohne,Sinus,Sprung},
		xmin=Ohne, xmax=Sprung,
		ytick={100,102.5,...,125},
		grid,
		legend entries={PID,MRAC,NN},
		legend columns=3,
		legend style={anchor=south,legend pos=north east, yshift=1cm, draw=none
		}
		]
		\addplot
		coordinates {(Ohne,117.38) (Sinus,) (Sprung,)};

		\addplot
		coordinates {(Ohne,117.84) (Sinus,122.24) (Sprung,101.96)};

		\addplot
		coordinates {(Ohne,118.29) (Sinus,118.63) (Sprung,101.51)};
	\end{axis}
\end{tikzpicture}

\begin{tikzpicture}
	\begin{axis}[
		x tick label style={
			/pgf/number format/1000 sep=},
		symbolic x coords={Ohne,Sinus,Sprung},
		ylabel=$\theta_{MSE}$,
		enlargelimits=0.15,
		ybar,
		bar width=7pt,
		xtick={Ohne,Sinus,Sprung},
		xmin=Ohne, xmax=Sprung,
		ytick={0,0.0005,...,0.005},
		grid,
		legend entries={PID,MRAC,NN},
		legend columns=3,
		legend style={anchor=south,legend pos=north east, yshift=1cm, draw=none
		}
		]
		\addplot
		coordinates {(Ohne,0.0019) (Sinus,) (Sprung,)};

		\addplot
		coordinates {(Ohne,0.0015) (Sinus,0.0046) (Sprung,0.0026)};

		\addplot
		coordinates {(Ohne,0.0015) (Sinus,0.0016) (Sprung,0.0013)};
	\end{axis}
\end{tikzpicture}

\begin{tikzpicture}
	\begin{axis}[
		x tick label style={
			/pgf/number format/1000 sep=},
		symbolic x coords={Ohne,Sinus,Sprung},
		ylabel=$q_{MSE}$,
		enlargelimits=0.15,
		ybar,
		bar width=7pt,
		xtick={Ohne,Sinus,Sprung},
		xmin=Ohne, xmax=Sprung,
		ytick={0,0.01,...,0.1},
		grid,
		legend entries={PID,MRAC,NN},
		legend columns=3,
		legend style={anchor=south,legend pos=north east, yshift=1cm, draw=none
		}
		]
		\addplot
		coordinates {(Ohne,0.0058) (Sinus,) (Sprung,)};

		\addplot
		coordinates {(Ohne,0.0029) (Sinus,0.0343) (Sprung,0.0210)};

		\addplot
		coordinates {(Ohne,0.0170) (Sinus,0.0822) (Sprung,0.0457)};
	\end{axis}
\end{tikzpicture}
\end{document}
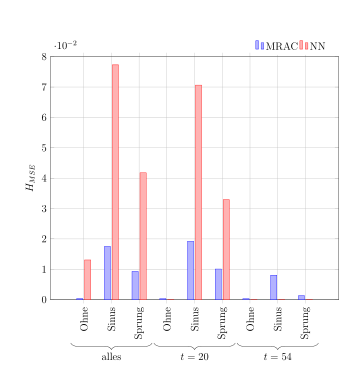
Besonders deutlich beim letzten. Eingegrenzt von 0-0.1, aber die Balken fangen innerhalb des Diagramms an, sollten aber wirklich ganz unten mit der definierten Zahl schon beginnen. Weiß jemand Rat? Die Grenzen ergeben sich aus den Messwerten, die in den Koordinaten geschrieben stehen. Zweites Probelm: Ist es vllt möglich die 10er Potenz schöner anzuordnen, oder gar eine andere, schönere Lösung zu finden?
P.S.:Ach noch vergessen: Begrenzung nach oben wird auch nicht genau eingehalten. geht immer noch etwas drüber als die angegebene maximale Angabe der y-Achse
Vielen Dank für eure Hilfe
Friedolien