Seite 1 von 1

Füllen von Flächen in Tikz-Umgebung

Verfasst: Di 5. Sep 2017, 14:20
von Patrick1990
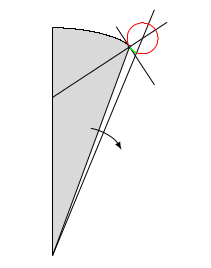
Hallo, ich würde gern Flächen farbig markieren (siehe Anhang).
Wie kann ich das angehen?

Hier das Minimalbeispiel:
\documentclass{article}

\usepackage{pgfplots}
\pgfplotsset{compat=1.15}

\begin{document}
\begin{tikzpicture}[scale=1,>=latex]
\begin{axis}[
    trig format plots=rad,
    axis equal,
    ymin=0, ymax = 250,
    xmin=0, xmax=200,
    hide axis
]
\draw[blue, fill=blue] (60.46181719,163.8889268) circle [blue, radius=1];
\addplot [domain=0 : 0.125*pi*0.9, samples=200, black] ({sin(x)*(179-0.8*(1/(cos(4*x))-1))}, {cos(x)*(179-0.8*(1/(cos(4*x))-1))});
%Tangente
\addplot[black, domain=50:80] {163.889 - 1.52393*(-60.4618 + x)};
%Orthogonale
\addplot[black, domain=0:90] {163.889 - 0.656199*(60.4618 - x)};
%Gerade 22.5°
\addplot[black, domain=0:80] {tan(pi/2-0.125*pi)*x};
\addplot [domain=0:2*pi, samples=50, red] ({70.6558+12.1928*cos(x)}, {170.578+12.1928*sin(x)});
\addplot [domain=1.18*pi:1.38*pi, samples=50, green] ({70.6558+12.1928*cos(x)}, {170.578+12.1928*sin(x)});
\draw (0,0) -- (0,179);
\draw (0,0) -- (60.46181719,163.8889268);
\draw[->] (30,100) arc (80:30:35);
\end{axis}
\end{tikzpicture}
\end{document}

Verfasst: Mi 6. Sep 2017, 22:11
von Stefan Kottwitz
Hallo,

Du kannst die fillbetween-library von pgfplots verwenden:
\documentclass[border=20pt]{standalone} 
\usepackage{pgfplots} 
\pgfplotsset{compat=newest} 
\usepgfplotslibrary{fillbetween}
\begin{document} 
\begin{tikzpicture}[scale=1,>=latex] 
\begin{axis}[ 
    trig format plots=rad, 
    axis equal, 
    ymin=0, ymax = 250, 
    xmin=0, xmax=200, 
    hide axis 
] 
\draw[blue, fill=blue] (60.46181719,163.8889268) circle [blue, radius=1]; 
\addplot [domain=0 : 0.125*pi*0.9, samples=200, black, name path = top]
  ({sin(x)*(179-0.8*(1/(cos(4*x))-1))}, {cos(x)*(179-0.8*(1/(cos(4*x))-1))}); 
%Tangente 
\addplot[black, domain=50:80] {163.889 - 1.52393*(-60.4618 + x)}; 
%Orthogonale 
\addplot[black, domain=0:90] {163.889 - 0.656199*(60.4618 - x)}; 
%Gerade 22.5° 
\addplot[black, domain=0:80] {tan(pi/2-0.125*pi)*x}; 
\addplot [domain=0:2*pi, samples=50, red] ({70.6558+12.1928*cos(x)},
  {170.578+12.1928*sin(x)}); 
\addplot [domain=1.18*pi:1.38*pi, samples=50, green] ({70.6558+12.1928*cos(x)},
  {170.578+12.1928*sin(x)}); 
\path[name path = left, draw] (0,0) -- (0,179); 
\path[name path = right, draw] (0,0) -- (60.46181719,163.8889268); 
\draw[->] (30,100) arc (80:30:35); 
\addplot[gray!30] fill between[of=top and right];
\end{axis} 
\end{tikzpicture} 
\end{document}
Bild

Auch bei Umrandung durch mehrere Kurven geht es, vmtl. mit zwei Schritten für Differenzbildung mit Füllen, wie Christian hier schrieb. Für Rückfragen bin ich evtl. nicht online, muss ein paar Tage reisen ab heute Abend.

Stefan

Verfasst: Do 7. Sep 2017, 14:56
von Patrick1990
Vielen Dank, konnte alles lösen.