Stacked Bar mit Zusatzlinien Thema ist als GELÖST markiert

Tabellen und Grafiken erstellen und anordnen


tekken01

Stacked Bar mit Zusatzlinien

Beitrag von tekken01 »

Sehr verehrtes Forum,

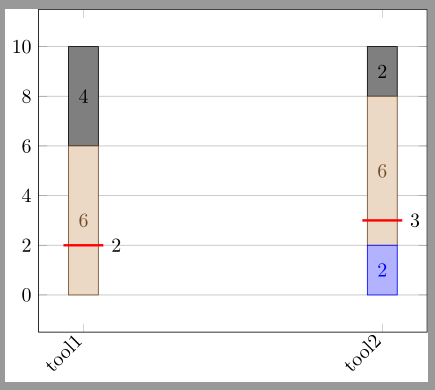
wie kann ich zusätzliche Striche in meinem Balkendiagram einzeichnen ? Ich hätte es gerne genauso wie hier:

Bild

ich dachte dass es möglicherweise über den draw Befehl ginge... :? Gibt es dazu eine elegante Lösung ?

hier mein minimalbeispiel:
\documentclass[tikz]{standalone}
\usepackage{pgfplots}
\pgfplotsset{compat=1.10}
\begin{document}
\begin{tikzpicture}
\begin{axis}[
ybar stacked,
bar width=15pt,
nodes near coords,
enlargelimits=0.15,
legend style={at={(0.5,-0.20)},
	anchor=north,legend columns=-1},
symbolic x coords={tool1, tool2},
xtick=data,
x tick label style={rotate=45,anchor=east},
]
%\draw[red, very thick] (axis cs:0.7-\,2) -- (axis cs:1.3+\,2);

\addplot+[ybar] plot coordinates {(tool1,0) (tool2,2) 	};
\addplot+[ybar] plot coordinates {(tool1,0) (tool2,0) 
	};
\addplot+[ybar] plot coordinates {(tool1,6) (tool2,6)	};
\addplot+[ybar] plot coordinates {(tool1,4) (tool2,2)};
\end{axis}
\end{tikzpicture}
\end{document}

esdd
Forum-Meister
Forum-Meister
Beiträge: 2561
Registriert: So 7. Feb 2010, 16:36

Beitrag von esdd »

Vielleicht geht das auch irgendwie eleganter, aber hier ist zumindest mal ein Vorschlag:
\documentclass[tikz]{standalone} 
\usepackage{pgfplots} 
\pgfplotsset{compat=1.10} 
\begin{document} 
\begin{tikzpicture}
  \begin{axis}[ 
      ybar stacked, 
      bar width=15pt, 
      nodes near coords, 
      enlargelimits=0.15, 
      legend style={at={(0.5,-0.20)}, 
        anchor=north,legend columns=-1}, 
      symbolic x coords={tool1, tool2}, 
      xtick=data, 
      x tick label style={rotate=45,anchor=east},
      ymajorgrids,
      /tikz/mstyle/.style={draw,red,very thick,text=black},
      /tikz/mleft/.style={xshift={-(.5*\pgfplotbarwidth+2.5pt)}},
      /tikz/mline/.style={insert path={--+({\pgfplotbarwidth+5pt},0pt)}},
    ]
    \path[mstyle]([mleft]axis cs:tool1,2)[mline]node[right]{$2$};
    \path[mstyle]([mleft]axis cs:tool2,3)[mline]node[right]{$3$};
    
    \addplot plot coordinates {(tool1,0) (tool2,2)}; 
    \addplot plot coordinates {(tool1,0) (tool2,0)}; 
    \addplot plot coordinates {(tool1,6) (tool2,6)}; 
    \addplot plot coordinates {(tool1,4) (tool2,2)};

  \end{axis} 
\end{tikzpicture} 
\end{document}
Bild

Beachte, dass Du beim Zeichnen der Striche die symbolischen x-Koordinaten verwenden musst. Ist es Absicht, dass Du Kompatibilität zu der recht alten Version 1.10 herstellst? Aktuell ist derzeit 1.14
Dateianhänge
gl_stackedplotmark.png
gl_stackedplotmark.png (9.91 KiB) 1248 mal betrachtet

Antworten