PGFPLOTS-Achsen Stellenweise vergrössern
Verfasst: Sa 4. Jun 2016, 21:41
Hallo liebe Forenmitglieder.
Könnte mir von euch jemand sagen wie ich einen Achsen Abschnittsweise vergrössern war.
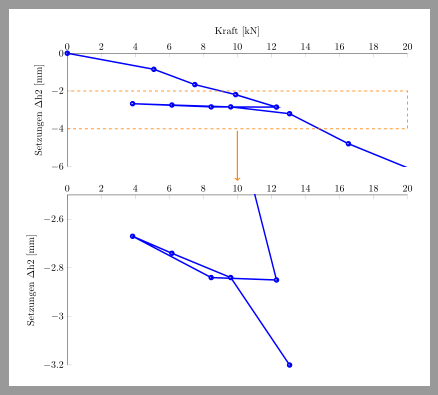
Ich würde gerne einen Graphen darstellen der zwischen den Zahlen -2 und -3 eine Grössere Auflösung darstellen.
Danke für Eure Hilfe
Bin in der Letzten zeit viel im Forum und lese mir viel hilfreich ding durch
Ich danke euch allen sehr für eure unterstützung
Könnte mir von euch jemand sagen wie ich einen Achsen Abschnittsweise vergrössern war.
Ich würde gerne einen Graphen darstellen der zwischen den Zahlen -2 und -3 eine Grössere Auflösung darstellen.
\documentclass[11pt]{article}
\usepackage[T1]{fontenc}
\usepackage[utf8]{inputenc}
\usepackage{pgfplots}
\pgfplotsset{compat=1.13}
\usetikzlibrary{decorations.pathreplacing}
\begin{document}
\begin{figure}
\begin{tikzpicture}
\begin{axis}[
width=12cm,
height=4cm,
scale only axis,
xmin=0,
xmax=20,
xlabel={Kraft [kN]},
ymin=-6,
ymax=0,
ylabel={Setzungen $\Delta$h2 [mm]},
axis x line*=top, %bottom, %top,
axis y line*=left
]
\addplot [
color= blue,
line width=1.5pt,
mark size=2.0pt,
%only marks,
mark=ball,
mark options={solid},
forget plot
]
table[row sep=crcr]{
0 0\\
5.09 -0.85 \\
7.50 -1.66 \\
9.90 -2.19 \\
12.30 -2.85 \\
8.46 -2.84 \\
3.84 -2.67 \\
6.15 -2.74 \\
9.61 -2.84 \\
13.07 -3.20 \\
16.53 -4.79 \\
21.14 -6.48 \\
% 26.91 -8.26 \\
% 38.44 -14.28 \\
% 57.66 -22.34 \\
% 79.19 -32.18 \\
% 0 0.384\\
% 0 -20\\
};
\draw [very thick,red](0.384,0) -- (0.384,-6);
\end{axis}
\end{tikzpicture}\vspace{-2ex}
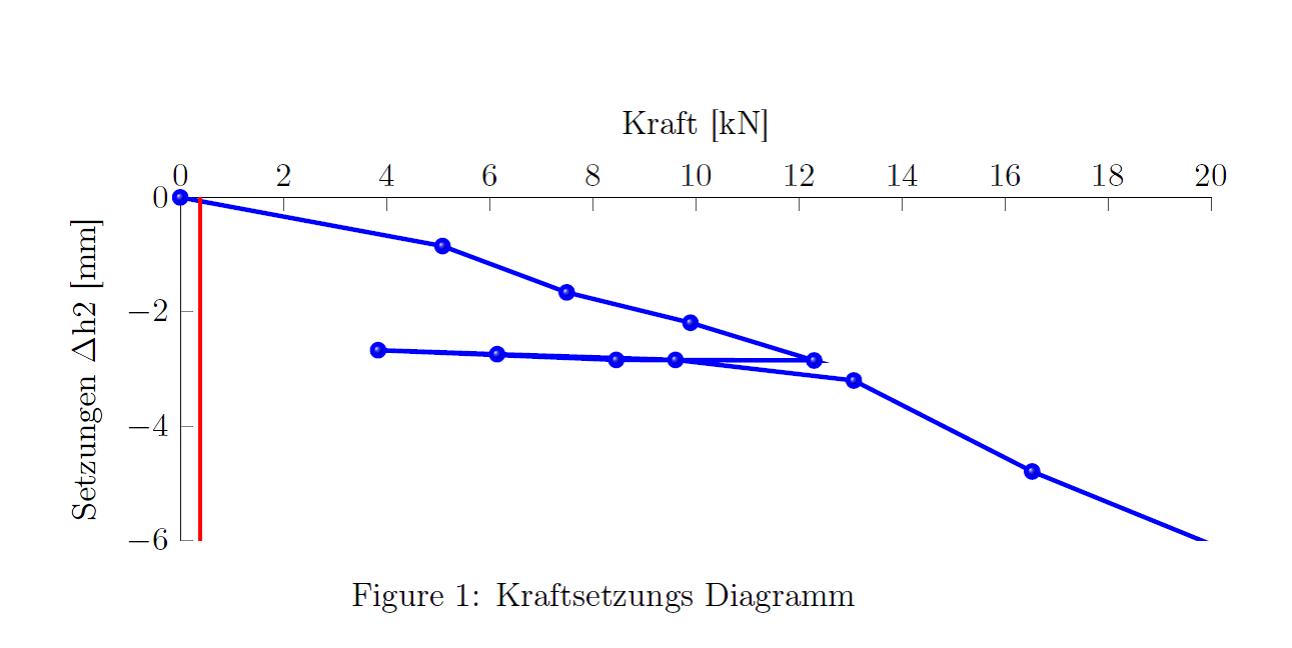
\caption{Kraftsetzungs Diagramm}
\label{KraftSetzDia}
\end{figure}
\end{document}
Danke für Eure Hilfe
Bin in der Letzten zeit viel im Forum und lese mir viel hilfreich ding durch
Ich danke euch allen sehr für eure unterstützung