Seite 1 von 1

Boxplot: pgfplotset innerhalb Achse anpassen

Verfasst: Sa 23. Apr 2016, 16:25
von pointloma
Hallo liebes Forum,

bisher konnte ich alle meine Fragen mit Hilfe von manuals, Forenbeiträgen oder durch simples Trial & Error beantworten, aber jetzt stehe ich doch vor einem mir unlösbarem Problem.

Ich möchte mehrere Boxplots aus verschiedenen .csv-Dateien in einer Achse darstellen, was auch problemlos funktioniert.

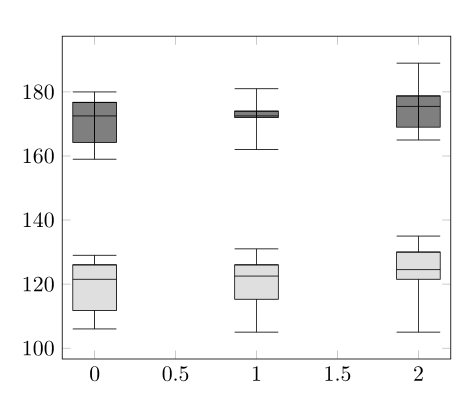
Das Problem: Die Boxplots haben alle die gleiche Farbe und sind deshalb nicht unterscheidbar. Ich möchte nun idealerweise die Boxplots mit verschiedenen Graustufen "füllen". Die Boxplots einer .csv-Datei sollen dabei die gleiche Füllung erhalten.

Nun habe ich ein \pgfplotsset, in dem die Einstellung für die Boxplots vorgenommen werden (nicht von mir geschrieben).

Ist es überhaupt möglich in meinem Code die Boxplots von abc.csv in einer anderen Farbe/Füllung darzustellen als die von xyz.csv?

Hier mein Code (minimaler ging leider nicht)
\begin{filecontents}{abc.csv}
index;median;box_top;box_bottom;whisker_top;whisker_bottom
0;121.5;126;111.75;129;106
1;122.5;126;115.25;131;105
2;124.5;130;121.5;135;105
\end{filecontents}

\begin{filecontents}{xyz.csv}
index;median;box_top;box_bottom;whisker_top;whisker_bottom
0;172.5;176.75;164.25;159;180
1;172.5;174;172;162;181
2;175.5;178.75;169;165;189
\end{filecontents}

\documentclass{scrreprt}
\usepackage{pgfplotstable}
\usetikzlibrary{pgfplots.statistics}
\pgfplotsset{compat=newest}

\begin{document}

\pgfplotsset{
    box plot/.style={
        /pgfplots/.cd,
        black,
        only marks,
        mark=-,
        mark size=1em,
        /pgfplots/error bars/.cd,
        y dir=plus,
        y explicit,
    },
    box plot box/.style={
        /pgfplots/error bars/draw error bar/.code 2 args={%
            \draw  ##1 -- ++(1em,0pt) |- ##2 -- ++(-1em,0pt) |- ##1 -- cycle;
        },
        /pgfplots/table/.cd,
        y index=2,
        y error expr={\thisrowno{3}-\thisrowno{2}},
        /pgfplots/box plot
    },
    box plot top whisker/.style={
        /pgfplots/error bars/draw error bar/.code 2 args={%
            \pgfkeysgetvalue{/pgfplots/error bars/error mark}%
            {\pgfplotserrorbarsmark}%
            \pgfkeysgetvalue{/pgfplots/error bars/error mark options}%
            {\pgfplotserrorbarsmarkopts}%
            \path ##1 -- ##2;
        },
        /pgfplots/table/.cd,
        y index=4,
        y error expr={\thisrowno{2}-\thisrowno{4}},
        /pgfplots/box plot
    },
    box plot bottom whisker/.style={
        /pgfplots/error bars/draw error bar/.code 2 args={%
            \pgfkeysgetvalue{/pgfplots/error bars/error mark}%
            {\pgfplotserrorbarsmark}%
            \pgfkeysgetvalue{/pgfplots/error bars/error mark options}%
            {\pgfplotserrorbarsmarkopts}%
            \path ##1 -- ##2;
        },
        /pgfplots/table/.cd,
        y index=5,
        y error expr={\thisrowno{3}-\thisrowno{5}},
        /pgfplots/box plot
    },
    box plot median/.style={
        /pgfplots/box plot
    }
}

\begin{figure}
\pgfplotstableread [col sep=semicolon]{abc.csv} {\abc}
\pgfplotstableread[col sep=semicolon] {xyz.csv} {\xyz}
\begin{tikzpicture}

		\begin{axis}
    \addplot [box plot median] table [col sep=semicolon]{\abc};
    \addplot [box plot box] table [col sep=semicolon]{\abc};
    \addplot [box plot top whisker] table [col sep=semicolon]{\abc};
    \addplot [box plot bottom whisker] table [col sep=semicolon]{\abc};
    
    \addplot [box plot median] table [col sep=semicolon]{\xyz};
    \addplot [box plot box] table [col sep=semicolon]{\xyz};
    \addplot [box plot top whisker] table [col sep=semicolon] {\xyz};
    \addplot [box plot bottom whisker] table  [col sep=semicolon]{\xyz};
    	\end{axis}	
	\end{tikzpicture}
\end{figure}
\end{document}
Danke schon mal im Vorraus für die Mühen!

Verfasst: Sa 23. Apr 2016, 17:13
von Bartman
Dein Beispiel ist nicht lauffähig. Bevor Du Deine csv-Dateien anhängst, füge deren Inhalt (oder zumindest soviel wie nötig) mithilfe von filecontents-Umgebungen Deinem Beispiel hinzu.

Folgende Änderung an Deiner Präambel müsste auch funktionieren:
%\usepackage{tikz}
%\usepackage{pgfplots}
\usepackage{pgfplotstable}

Verfasst: Sa 23. Apr 2016, 17:24
von pointloma
Danke für den Hinweis, ist ja auch eigentlich logisch!

Ich habe das Beispiel angepasst.

Verfasst: Sa 23. Apr 2016, 21:26
von esdd
Eine Möglichkeit wäre
     box plot fill/.style={
       box plot/.append style={
         /pgfplots/.cd,fill=#1
       }
     },
     box plot fill/.default=none,
in dem \pgfplotsset zu ergänzen und dann zum Beispiel
\addplot [box plot fill=lightgray!50,box plot box] table [col sep=semicolon]{\abc}; 
zu nutzen.

Bild

Code:
\begin{filecontents}{abc.csv} 
 index;median;box_top;box_bottom;whisker_top;whisker_bottom 
 0;121.5;126;111.75;129;106 
 1;122.5;126;115.25;131;105 
 2;124.5;130;121.5;135;105 
\end{filecontents} 

\begin{filecontents}{xyz.csv} 
 index;median;box_top;box_bottom;whisker_top;whisker_bottom 
 0;172.5;176.75;164.25;159;180 
 1;172.5;174;172;162;181 
 2;175.5;178.75;169;165;189 
\end{filecontents} 

\documentclass{scrreprt} 
\usepackage{pgfplotstable} 
\usetikzlibrary{pgfplots.statistics} 
\pgfplotsset{compat=newest} 

\begin{document} 

\pgfplotsset{ 
     box plot/.style={ 
         /pgfplots/.cd, 
         black,
         only marks, 
         mark=-, 
         mark size=1em, 
         /pgfplots/error bars/.cd, 
         y dir=plus, 
         y explicit, 
     },
     box plot fill/.style={
       box plot/.append style={
         /pgfplots/.cd,fill=#1
       }
     },
     box plot fill/.default=none,
     box plot box/.style={ 
         /pgfplots/error bars/draw error bar/.code 2 args={% 
             \draw  ##1 -- ++(1em,0pt) |- ##2 -- ++(-1em,0pt) |- ##1 -- cycle; 
         }, 
         /pgfplots/table/.cd, 
         y index=2, 
         y error expr={\thisrowno{3}-\thisrowno{2}}, 
         /pgfplots/box plot 
     },
     box plot top whisker/.style={ 
         /pgfplots/error bars/draw error bar/.code 2 args={% 
             \pgfkeysgetvalue{/pgfplots/error bars/error mark}% 
             {\pgfplotserrorbarsmark}% 
             \pgfkeysgetvalue{/pgfplots/error bars/error mark options}% 
             {\pgfplotserrorbarsmarkopts}% 
             \path ##1 -- ##2; 
         }, 
         /pgfplots/table/.cd, 
         y index=4, 
         y error expr={\thisrowno{2}-\thisrowno{4}}, 
         /pgfplots/box plot 
     }, 
     box plot bottom whisker/.style={ 
         /pgfplots/error bars/draw error bar/.code 2 args={% 
             \pgfkeysgetvalue{/pgfplots/error bars/error mark}% 
             {\pgfplotserrorbarsmark}% 
             \pgfkeysgetvalue{/pgfplots/error bars/error mark options}% 
             {\pgfplotserrorbarsmarkopts}% 
             \path ##1 -- ##2; 
         }, 
         /pgfplots/table/.cd, 
         y index=5, 
         y error expr={\thisrowno{3}-\thisrowno{5}}, 
         /pgfplots/box plot 
     }, 
     box plot median/.style={ 
         /pgfplots/box plot 
     } 
} 

\begin{figure} 
\pgfplotstableread [col sep=semicolon]{abc.csv} {\abc} 
\pgfplotstableread[col sep=semicolon] {xyz.csv} {\xyz} 
\begin{tikzpicture} 
   \begin{axis}
     \addplot [box plot median] table {\abc}; 
     \addplot [box plot fill=lightgray!50,box plot box] table {\abc}; 
     \addplot [box plot top whisker] table {\abc}; 
     \addplot [box plot bottom whisker] table {\abc}; 
     
     \addplot [box plot median] table {\xyz}; 
     \addplot [box plot fill=gray,box plot box] table {\xyz}; 
     \addplot [box plot top whisker] table {\xyz}; 
     \addplot [box plot bottom whisker] table  {\xyz}; 
   \end{axis}   
\end{tikzpicture} 
\end{figure} 
\end{document}

Verfasst: Sa 23. Apr 2016, 21:45
von pointloma
Ich danke dir vielmals!

Hätte ich das auch dem Manual von Pgfplot entnehmen können?

Verfasst: So 24. Apr 2016, 12:00
von esdd
pointloma hat geschrieben: Hätte ich das auch dem Manual von Pgfplot entnehmen können?
Letztlich basiert das zwar fast alles auf Infos aus den Dokus zu TikZ und pgfplots, aber unmittelbar entnehmen kann man das diesen genauso wenig wie den Code, den Du schon aus anderer Quelle hattest ;-)

Verfasst: So 24. Apr 2016, 13:42
von pointloma
esdd hat geschrieben:
pointloma hat geschrieben: Hätte ich das auch dem Manual von Pgfplot entnehmen können?
Letztlich basiert das zwar fast alles auf Infos aus den Dokus zu TikZ und pgfplots, aber unmittelbar entnehmen kann man das diesen genauso wenig wie den Code, den Du schon aus anderer Quelle hattest ;-)
Gut, dann bin ich beruhigt. ;)