Legende pgfplots Legendeneinträge zusammenfassen
Verfasst: Mo 7. Mär 2016, 13:55
Hallo zusammen,
ich habe folgendes Problem:
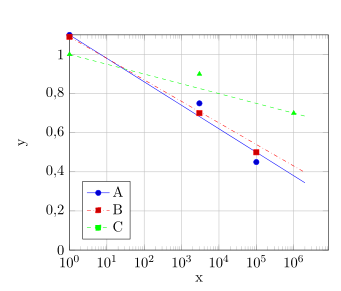
ich habe 3 Messergebnisse in einem semilogarithmischen Diagramm. Für diese habe ich einen fit erstellt und ebenfalls in mein Diagramm gezeichnet. Da zwei Linien aber fast übereinander liegen, habe ich die farblich voneinander abgehoben und die Fits sollen mit in die Legende. Was ich jetzt aber habe sind 6 Einträge für 3 Datensätze, jeweils einmal als Punkt, einmal als Linie. Was ich gerne hätte ist, in der Legende Punkt und Linie übereinander legen, so dass ich nur noch drei Einträge mit jeweils Punkt und Linie habe. Sorry ist recht umständlich formuliert aber ich hoffe es kommt rüber.
Anbei das Minimalbeispiel, wie es jetzt ungefähr aussieht.
Vielen Dank euch!
ich habe folgendes Problem:
ich habe 3 Messergebnisse in einem semilogarithmischen Diagramm. Für diese habe ich einen fit erstellt und ebenfalls in mein Diagramm gezeichnet. Da zwei Linien aber fast übereinander liegen, habe ich die farblich voneinander abgehoben und die Fits sollen mit in die Legende. Was ich jetzt aber habe sind 6 Einträge für 3 Datensätze, jeweils einmal als Punkt, einmal als Linie. Was ich gerne hätte ist, in der Legende Punkt und Linie übereinander legen, so dass ich nur noch drei Einträge mit jeweils Punkt und Linie habe. Sorry ist recht umständlich formuliert aber ich hoffe es kommt rüber.
Anbei das Minimalbeispiel, wie es jetzt ungefähr aussieht.
\documentclass{scrartcl}
\usepackage{pgfplots}
\pgfplotsset{/pgf/number format/use comma}
\usetikzlibrary{patterns}

\begin{filecontents*}{data.txt}
xa	ya	xb	yb	xc	yc
1	1.1	1	1.09	1	1
3000	0.75	3000	0.7	3000	0.9
100000	0.45	100000	0.5	1000000	0.7
\end{filecontents*}

\begin{document}

\begin{tikzpicture}
   \begin{semilogxaxis}[
%    width=10cm,
   	xlabel={x},
   	ylabel={y},
   	ymin=0, ymax=1.1,
   	xmin=1,
 	xtick align=inside,
	ymajorgrids=true,
	xmajorgrids=true,
%	xminorgrids=true,
	legend style={at={(0.05,0.05)}, anchor=south west},
	legend cell align=left,
	legend entries={A, B, C, A, B, C}
   	]
     \addplot+[only marks] table[x=xa, y=ya] {data.txt};
     \addplot+[only marks] table[x=xb, y=yb] {data.txt};
     \addplot[only marks,green,mark=triangle*] table[x=xc, y=yc] {data.txt};
     \addplot[blue,domain=1:2000000]{1.1-0.12*log10(x)};
     \addplot[red,dashdotted,domain=1:2000000]{1.09-0.11*log10(x)};
     \addplot[green,dashed,domain=1:2000000]{1-0.05*log10(x)};
   \end{semilogxaxis}
\end{tikzpicture}

\end{document}