Seite 1 von 1
Fehler in einer Tabelle
Verfasst: Do 17. Dez 2015, 16:41
von Kinmoku
... aber wo?
Hallo allerseits,
ich bin noch relativ unerfahren was LaTeX angeht. Ich möchte gerne eine Tabelle erstellen für meine Doktorarbeit wie im angehängten Bild. Allerdings habe ich bislang eine Bandbreite an Fehlermeldungen erhalten (meist war \end{tabularx}irgendwo das Problem. Leider weiß ich nicht, warum. Muss ich irgendein spezielles Paket laden, vor allem weil diese Tabelle fürchterlich breit sein wird?
Vielen Dank für eure Hilfe!
Kinmoku
\begin{table}
\myfloatalign
\begin{tabularx}{\columnwidth}{llllllllllll}
\begin{center}
\toprule
A& Cp \par{[pF]} & Resting V\textsubscript{mem} \par{[mV]} & I\textsubscript{th} \par{[pA]}& V\textsubscript{th} \par{[pA]} & AP amplitude \par{[mV]}& AP Peak \par{[mV]}& Time to peak \par{[ms]}& AHP amplitude \par{[mV]} & AHP duration \par{[ms]}& Max. AP numbers\\
\midrule
Glass+PLL & 22.1 $\pm$ 1.2 & \num{-80.5} $\pm$ 1.2 & 206 $\pm$ 6 & \num{-34} $\pm$ 1 & 70.1 $\pm$ 1.9 & 37.1 $\pm$ 1.7 & 2.3 $\pm$ 0.1 & 19.6 $\pm$ 1.7 & 37.7 $\pm$ 2.6 & 1.1 $\pm$ 0.1\\
T4Lys & 25.5 $\pm$ 1.6 & \num{-71.4} $\pm$ 1.5** & 198 $\pm$ 6 & \num{-33} $\pm$ 1 & 67.7 $\pm$ 2.4 & 34.8 $\pm$ 2.4 & 2.4 $\pm$ 0.1 & 17.8 $\pm$ 2.1 & 38.5 $\pm$ 3.0 & 1.5 $\pm$ 0.1\\
\bottomrule
\end{tabularx}

\caption{Passive and excitability properties of DRG neurons on Glass+PLL and T4Lys. Significant difference was observed for Vmem and the maximum number of action potentials evoked per 100 ms. Cp: membrane capacitance; Resting V\textsubscript{mem}: resting membrane potential; I\textsubscript{th}: threshold current; V\textsubscript{th}: voltage threshold; AP: action potential; AHP: after hyperpolarization period amplitude; n values were n = 24 for Glass + PLL and n = 18 for Glass+T4Lys. *p < 0.05, **p < 0.01 Significant difference between PLL and T4Lys.}
\label{tab:T4Lysproperties}
\end{table}
Verfasst: Do 17. Dez 2015, 17:44
von Beinschuss
Erstelle bitte ein lauffähiges
Minimalbeispiel, das den Fehler zeigt, und nicht nur diesen zum Testen unbrauchbaren Codeausschnitt.
Verfasst: Do 17. Dez 2015, 18:25
von Johannes_B
Ich würde die Tabelle einfach in der Logik drehen. Eine Spalte für die Parameter, eine für Glass und eine für T4Lys.
Verfasst: Fr 18. Dez 2015, 08:56
von Stefan Kottwitz
Hallo Kinmoku,
das \begin{center} muss weg, das sollte gar nicht in eine tabular oder tabularx Tabelle hinein. Es fehlt das \end{center}, daher kommt der Fehler.
Stattdessen nimm für ein Zentrieren der gesamten Tabelle ein \centering direkt nach begin{table}. Für das Zentrieren von Spalten sollte \centering in die Spaltendefinition, oder man verwendet dort gleich c statt l.
\par ist übrigens kein Befehl mit Argument in geschweiften Klammern. Es macht einfach einen Absatzumbruch. In Tabellen-Zellen auch nicht wirklich gut.
Für wissenschaftliche Einheiten empfiehlt sich das Paket
siunitx. Das unterstützt direkt Tabellen mit Einheiten und Ausrichtung an Dezimalpunkten.
Stefan
Verfasst: Fr 18. Dez 2015, 12:40
von Gast
So könnte ein Beispiel aussehen:
\documentclass{scrartcl}

\usepackage[utf8]{inputenc}
\usepackage[T1]{fontenc}
\usepackage{lmodern}
\usepackage{microtype}

\usepackage[english]{babel}
\usepackage{booktabs}
\usepackage{mathtools}
\usepackage{siunitx}
\sisetup{separate-uncertainty = true}
\DeclareSIUnit[number-unit-product=\;]\number{number}

\begin{document}

\begin{table}
\centering
\caption{Passive and excitability properties of DRG neurons on Glass+PLL and T4Lys. Significant difference was observed for $V_{\text{mem}}$ and the maximum number of action potentials evoked per \SI{100}{\milli\second}. Cp: membrane capacitance; Resting $V_{\text{mem}}$: resting membrane potential; $I_{th}$: threshold current; $V_{th}$: voltage threshold; AP: action potential; AHP: after hyperpolarization period amplitude; $n$ values were $n=24$ for Glass+PLL and $n=18$ for Glass+T4Lys. \textsuperscript{*} $p<0.01$ Significant difference between PLL and T4Lys, \textsuperscript{**} $p<0.05$.}
\label{tab:T4Lysproperties}
\begin{tabular}{%
    r
    S[table-format = -3.1(2)]
    S[%
        table-figures-integer = 3,
        table-figures-decimal = 1,
        table-figures-uncertainty = 2,
        table-sign-mantissa,
        table-space-text-post = \textsuperscript{**} ,
        table-number-alignment = center
    ]
}
\toprule
 & {Glass+PLL} & {T4Lys} \\
\midrule
$C_p$ [\si{\pico\farad}] & 22.1+-1.2 & 25.5+-1.6\\
Resting $V_{\text{mem}}$ [\si{\milli\volt}] & -80.5+-1.2 & -71.4+-1.5 \textsuperscript{*}\\
$I_{th}$ [\si{\pico\ampere}] & 206+-6 & 198+-6\\
$V_{th}$ [\si{\milli\volt}] & -34+-1 & -33+-1\\
AP amplitude [\si{\milli\volt}] & 71.0+-1.9 & 67.7+-2.4\\
AP peak [\si{\milli\volt}] & 37.1+-1.7 & 34.8+-2.4\\
Time to peak [\si{\milli\second}] & 2.3+-0.1 & 2.4+-0.1\\
AHP amplitude [\si{\milli\volt}] & 19.6+-1.7 & 17.8+-2.1\\
AHP duration [\si{\milli\second}] & 37.7+-2.6 & 38.5+-3.0\\
Max. AP \si[per-mode=symbol]{\number\per\second} & 1.1+-0.1 & 1.5+-0.1 \textsuperscript{**}\\
\bottomrule
\end{tabular}
\end{table}

\end{document}
Verfasst: Fr 18. Dez 2015, 12:51
von Gast
Hm. Was soll denn Einheit von Pico-Farad sein? Warum nicht gleich eine korrekte Darstellung
\documentclass{scrartcl}

\usepackage[utf8]{inputenc}
\usepackage[T1]{fontenc}
\usepackage{lmodern}
\usepackage{microtype}

\usepackage[english]{babel}
\usepackage{booktabs}
\usepackage{mathtools}
\usepackage{siunitx}
\sisetup{separate-uncertainty = true}
\DeclareSIUnit[number-unit-product=\;]\number{number}

\begin{document}

\begin{table}
\centering
\caption{Passive and excitability properties of DRG neurons on Glass+PLL and T4Lys. Significant difference was observed for $V_{\text{mem}}$ and the maximum number of action potentials evoked per \SI{100}{\milli\second}. Cp: membrane capacitance; Resting $V_{\text{mem}}$: resting membrane potential; $I_{th}$: threshold current; $V_{th}$: voltage threshold; AP: action potential; AHP: after hyperpolarization period amplitude; $n$ values were $n=24$ for Glass+PLL and $n=18$ for Glass+T4Lys. \textsuperscript{*} $p<0.01$ Significant difference between PLL and T4Lys, \textsuperscript{**} $p<0.05$.}
\label{tab:T4Lysproperties}
\begin{tabular}{%
r
S[table-format = -3.1(2)]
S[%
table-figures-integer = 3,
table-figures-decimal = 1,
table-figures-uncertainty = 2,
table-sign-mantissa,
table-space-text-post = \textsuperscript{**} ,
table-number-alignment = center
]
}
\toprule
& {Glass+PLL} & {T4Lys} \\
\midrule
$C_p$ / \si{\pico\farad} & 22.1+-1.2 & 25.5+-1.6\\
Resting $V_{\text{mem}}$ / \si{\milli\volt} & -80.5+-1.2 & -71.4+-1.5 \textsuperscript{*}\\
$I_{th}$ / \si{\pico\ampere} & 206+-6 & 198+-6\\
$V_{th}$ / \si{\milli\volt} & -34+-1 & -33+-1\\
AP amplitude in \si{\milli\volt} & 71.0+-1.9 & 67.7+-2.4\\
AP peak in \si{\milli\volt} & 37.1+-1.7 & 34.8+-2.4\\
Time to peak in \si{\milli\second} & 2.3+-0.1 & 2.4+-0.1\\
AHP amplitude in \si{\milli\volt} & 19.6+-1.7 & 17.8+-2.1\\
AHP duration in \si{\milli\second} & 37.7+-2.6 & 38.5+-3.0\\
Max. AP in \si[per-mode=symbol]{\number\per\second} & 1.1+-0.1 & 1.5+-0.1 \textsuperscript{**}\\
\bottomrule
\end{tabular}
\end{table}

\end{document}
Verfasst: Fr 18. Dez 2015, 15:06
von Gast
Anonymous hat geschrieben:Hm. Was soll denn Einheit von Pico-Farad sein? Warum nicht gleich eine korrekte Darstellung […]
Mir ist sehr wohl bewusst, dass die Angabe der Einheiten in eckigen Klammern genau genommen wissenschaftlich nicht korrekt ist. Die Verwendung der eckigen Klammern um die Einheit wird trotzdem häufig so verwendet. In der Graphik des Threaderstellers ist es auch so zu sehen. Da hatte ich es einfach übernommen. Ebenso nutzen auch manche wissenschaftlichen Programme diese Notation Beschreibung [Einheit] (statt korrekterweise Beschreibung/Einheit) wie beispielsweise Origin oder Igor.
Entschuldigen Sie bitte, wenn ich mich unberechtigt auf die Füße getreten fühle. Ich hatte mir die Mühe gemacht und ein Beispiel mit den vorgenannten Vorschlägen erstellt. Ihr Kommentar zu diesem Beispiel erscheint mir flapsig.
Verfasst: Fr 18. Dez 2015, 20:06
von Bartman
Ich habe das Beispiel aus dem Beitrag des Gastes von 12:40 Uhr aufgegriffen und ein paar Änderungen getätigt.
Die Anpassung der Argumente von \DeclareSIUnit war aufgrund der s-Spalte nötig, weil die Variante des Gastes, in dem von mir geänderten Beispiel, zu einer Fehlermeldung führte. Mein Aufruf von \multicolumn1c{} in der Kopfzeile der Tabelle ist zwar nicht schön, verhindert aber die beiden eckigen Klammern in dieser Zelle.
Die Ziele der Stern-Verweise in der Tabelle sind nun Fußnoten derselben und nicht mehr Teil der Beschriftung.
\usepackage[utf8]{inputenc}
\usepackage[T1]{fontenc}
\usepackage{lmodern}
\usepackage[english]{babel}
\usepackage[babel]{microtype}
\usepackage{booktabs}
\usepackage{threeparttable}
\usepackage{siunitx}
\sisetup{separate-uncertainty}
\DeclareSIUnit{\numberpersecond}{number\per\s}
\begin{document}
\begin{table}[htbp]
\centering
\renewcommand{\arraystretch}{1.5}
\begin{threeparttable}
\begin{tabular}{
l
>{[}s<{]}
S[table-format = -3.1(2)]
S[%
table-figures-integer = 3,
table-figures-decimal = 1,
table-figures-uncertainty = 2,
table-sign-mantissa,
table-space-text-post = \textsuperscript{**},
table-number-alignment = center
]
}
\toprule
& \multicolumn1c{} & {Glass+PLL} & {T4Lys}\\
\midrule
$C_p$ & \pF & 22.1(12) & 25.5(16)\\
Resting $V_\mathrm{mem}$ & \mV & -80.5(12) & -71.4(15)\tnote{**}\\
$I_\mathrm{th}$ & \pA & 206(6) & 198(6)\\
$V_\mathrm{th}$ & \mV & -34(1) & -33(1)\\
AP amplitude & \mV & 71.0(19) & 67.7(24)\\
AP peak & \mV & 37.1(17) & 34.8(24)\\
Time to peak & \ms & 2.3(1) & 2.4(1)\\
AHP amplitude & \mV & 19.6(17) & 17.8(21)\\
AHP duration & \ms & 37.7(26) & 38.5(30)\\
Max. AP & \numberpersecond & 1.1(1) & 1.5(1)\tnote{*}\\
\bottomrule
\end{tabular}
\begin{tablenotes}[para, flushleft]
\footnotesize
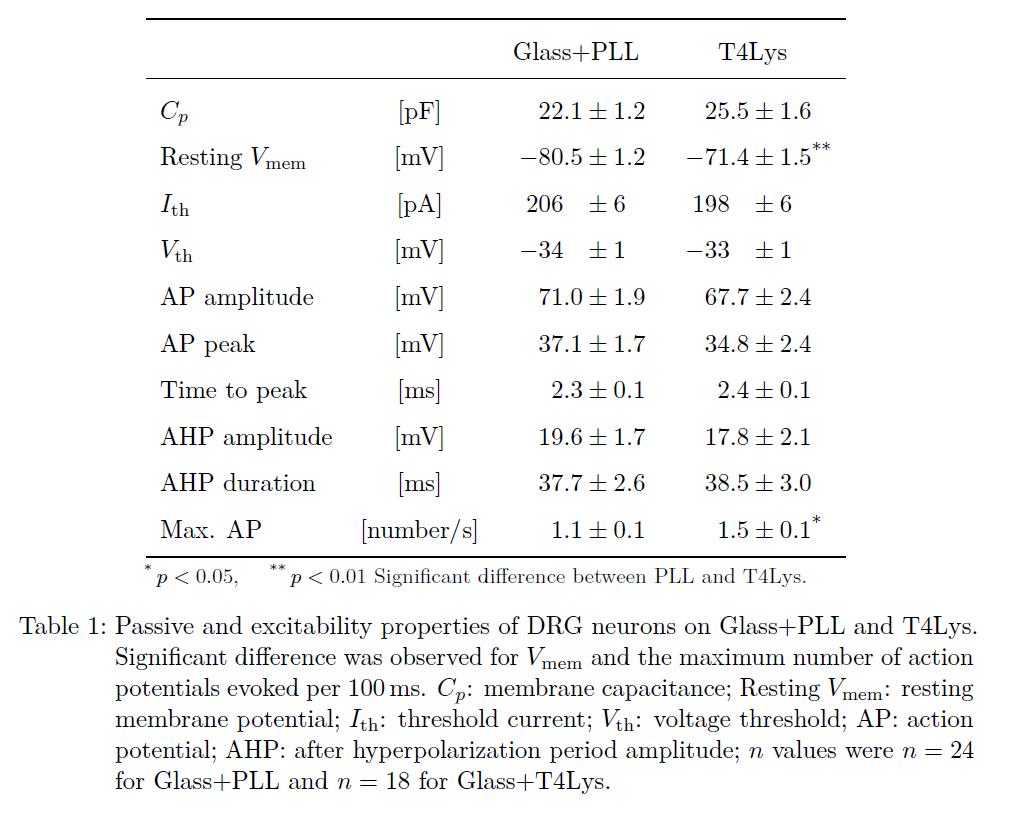
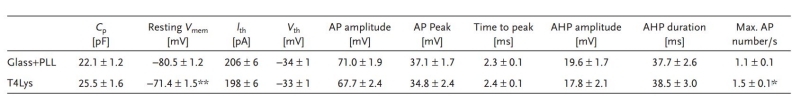
\item[*] $p < 0.05$, \item[**] $p < 0.01$ Significant difference between PLL and T4Lys.
\end{tablenotes}
\end{threeparttable}
\caption{Passive and excitability properties of DRG neurons on Glass+PLL and T4Lys. Significant difference was observed for $V_\mathrm{mem}$ and the maximum number of action potentials evoked per \SI{100}{\ms}. $C_p$: membrane capacitance; Resting $V_\mathrm{mem}$: resting membrane potential; $I_\mathrm{th}$: threshold current; $V_\mathrm{th}$: voltage threshold; AP: action potential; AHP: after hyperpolarization period amplitude; $n$ values were $n = 24$ for Glass+PLL and $n = 18$ for Glass+T4Lys.}
\label{tab:T4Lysproperties}
\end{table}
\end{document}