Graph mit node versehen
Verfasst: Fr 26. Jun 2015, 11:11
Moin,
folgendes Problem habe ich:
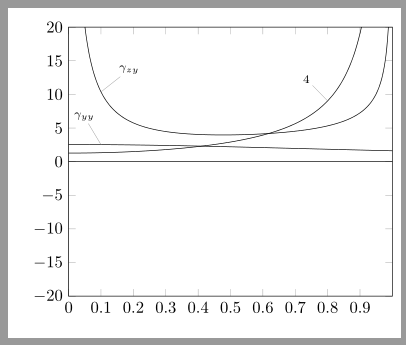
Ich möchte einen plot bezeichnen. In meinem Minimalbeispiel ist die Variante mit Gamma_zy am besten. Bei den anderen erkennt man, dass die Bezeichnungslinie immer an den Knoten im Westen geht. Meine Frage nun ist, wie ich die Position, an der die Linie von der Bezeichnung weggeht ändern kann. Im Endeffekt geht es mir darum die plot zu bezeichnen, wie es bei Gamma_zy der Fall ist. Andere mögliche Wege sind auch gerne gesehen.
Hier mein Minimalbeispiel:
Vielen Dank schonmal!
folgendes Problem habe ich:
Ich möchte einen plot bezeichnen. In meinem Minimalbeispiel ist die Variante mit Gamma_zy am besten. Bei den anderen erkennt man, dass die Bezeichnungslinie immer an den Knoten im Westen geht. Meine Frage nun ist, wie ich die Position, an der die Linie von der Bezeichnung weggeht ändern kann. Im Endeffekt geht es mir darum die plot zu bezeichnen, wie es bei Gamma_zy der Fall ist. Andere mögliche Wege sind auch gerne gesehen.
Hier mein Minimalbeispiel:
\documentclass[12pt,a4paper]{scrreprt}

\usepackage[utf8]{inputenc}
\usepackage[T1]{fontenc}
\usepackage[ngerman]{babel}
\usepackage{amsmath}
\usepackage{amsfonts}
\usepackage{amssymb}
\usepackage{tikz}
\usepackage{pgfplots}
\usetikzlibrary{intersections}
\usetikzlibrary{positioning,shadings}

\usepgfplotslibrary{units}
\pgfplotsset{compat = newest}

\pgfkeys{/pgfplots/linelabel/.style args={#1:#2:#3}{name path global=labelpath,execute at end plot={
\path [name path global = labelpositionline]
(rel axis cs:#1,0) --
(rel axis cs:#1,1);
\draw [help lines,text=black,inner sep=0pt,name intersections={of=labelpath and labelpositionline}] (intersection-1) -- +(#2) node [label={#3}] {};},
}}


\begin{document}
\begin{tikzpicture}
    \begin{axis}[domain=0:1,samples=400, xmin=0,xmax=1,xtick={0,0.1,...,1},ymin=-20, ymax=20,ytick={-20,-15,...,20}]
		\addplot+[black,mark=none, thin] {0};
        \addplot+[black,mark=none,linelabel=0.1:{90:0.3cm}:{[black]right:$\gamma_{yy}$}] {(2*pi^2+(16-pi^2)*x^2)*4/((pi^2+(16-pi^2)*x^2)^1.5)};
        \addplot+[black,mark=none,linelabel=0.1:{45:0.75cm}:{[black]right:$\gamma_{zy}$}] {pi/4*(pi^2+(32+pi^2)*x^2+(32-2*pi^2)*x^4)/(x*(1-x^2)^0.5)*4/((pi^2+(16-pi^2)*x^2)^1.5)};
        \addplot+[black,mark=none,linelabel=0.8:{135:0.75cm}:{[black]right:$4$}][domain=0:0.95] {(pi^2+(32+pi^2)*x^2+(32-2*pi^2)*x^4)/(1-x^2)*4/((pi^2+(16-pi^2)*x^2)^1.5))};
            \end{axis}
\end{tikzpicture}
\end{document}
Vielen Dank schonmal!