Alignment mehrerer tikz pictures untereinander mit zwei y ac
Verfasst: Sa 30. Mai 2015, 23:00
Hallo Leute,
ich habe eine Frage zur Positionierung von tikzpictures, für Minimalbeispiel siehe anbei.
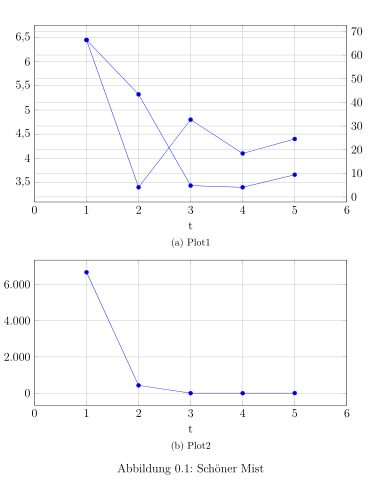
Zur Anordnung der beiden pgf-plots mit gleicher x Achse nutze ich "trim axis left" als Argument für den tikz-Aufruf. Das funktioniert auch wunderschön, solange keine zweite y-Achse ins Spiel kommt. Ich möchte eines der beiden Bilder mit zwei y Achsen haben (per axis-overlay) und die Zeichenbereiche sollen exakt gleich breit sein.
Könnt ihr mir helfen? Vielen Dank
Andreas
ich habe eine Frage zur Positionierung von tikzpictures, für Minimalbeispiel siehe anbei.
Zur Anordnung der beiden pgf-plots mit gleicher x Achse nutze ich "trim axis left" als Argument für den tikz-Aufruf. Das funktioniert auch wunderschön, solange keine zweite y-Achse ins Spiel kommt. Ich möchte eines der beiden Bilder mit zwei y Achsen haben (per axis-overlay) und die Zeichenbereiche sollen exakt gleich breit sein.
Könnt ihr mir helfen? Vielen Dank
Andreas
\documentclass[a4paper,12pt]{scrreprt}
\usepackage{lmodern}
\usepackage{pifont}
\usepackage[german]{babel}
\selectlanguage{german}
\usepackage[T1]{fontenc}
\usepackage{float}
\usepackage[hang,font=singlespacing]{caption}
\usepackage{tikz}
\usepackage{pgfplots}
\pgfplotsset{/pgf/number format/use comma, compat=newest}
\usetikzlibrary{patterns}
\usepackage{subfig}

\begin{document}
\begin{figure}
\begin{center}

\subfloat[Plot1]{
\begin{tikzpicture}[trim axis left]
	\begin{axis}[width=0.8\textwidth,height=0.35\textheight,
	%axis  y  line*=left,%    the  ’*’  avoids  arrow  heads
	grid,
	xlabel near ticks,
  ylabel near ticks,
	xmin=0,
	xmax=6,
	xlabel={t}]
	\addplot coordinates {(1,6.45)(2,3.4)(3,4.8)(4,4.1)(5,4.4)};

	\end{axis}
%
	\begin{axis}[width=0.8\textwidth,height=0.35\textheight,
	axis  y  line*=right,
	grid,
	xmin=0,
	xmax=6,
	xlabel near ticks,
  ylabel near ticks]
      \addplot coordinates {(1,66.4)(2,43.4)(3,4.8)(4,4.1)(5,9.4)};
		\end{axis}
\end{tikzpicture}

}

\subfloat[Plot2]{
\begin{tikzpicture}[trim axis left]
	  \begin{axis}[width=0.8\textwidth,height=0.3\textheight,
		grid,
		xmin=0,
   	xmax=6,
		xlabel={t},
		legend pos=north east]
      \addplot coordinates {(1,6666.4)(2,433.4)(3,4.8)(4,4.1)(5,9.4)};
			\end{axis}


	\end{tikzpicture}
}

\caption{Schöner Mist}
\end{center}
\end{figure}

\end{document}