CrazyHorse hat geschrieben:
Was genau ist jetzt dein Problem?
Herbert
Wie in Beitrag 1 geschrieben: Wie kann ich die z-Achse skalieren.
Und Beitrag 5:
Meine x-Achse startet nicht bei 0, also bekomme ich scheinbar nichts angezeigt.
sehe es mir am Wochenende an ...
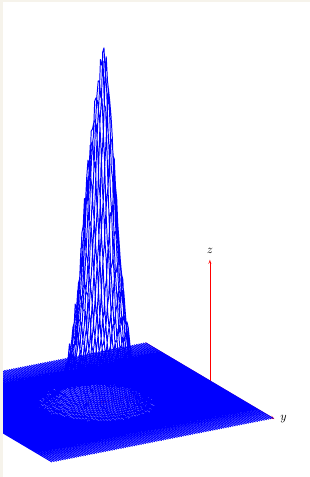
eine mögliche Lösung:
\documentclass{standalone}
\usepackage[utf8]{inputenc}

\usepackage{amsmath,amssymb}
\usepackage{pst-3dplot}
\usepackage{pstricks-add}
\makeatletter
\pst@def{ScalePointsThreeD}<%
  counttomark dup dup cvi eq not { exch pop } if
  /m exch def /n m 3 div cvi def
  n { 				% now we have x y z
    3 -1 roll
    490 sub 2 div % (x-490)/2
    3 1 roll
    exch 2 div % y/2
    exch
    tx@3DPlotDict begin
    saveCoor
    ConvertTo2D
    x2D \pst@number\psxunit mul y2D \pst@number\psyunit mul
    end
    m 1 sub 1 roll m 1 sub 1 roll /m m 3 sub def } repeat>
\makeatother
\pagestyle{empty}

\begin{document}

\begin{pspicture}(-6,-3)(5,11)
\psset{Alpha=30, Beta=20, unit=0.75}
\pstThreeDCoor[%
  xMin=0,xMax=5,%
  yMin=-5,yMax=5,%
  zMin=0,zMax=5]
\readdata{\spatialResolutionFifty}{SpatialAverage_Time_2.txt}
\listplotThreeD[plotstyle=line,linecolor=blue,
     drawStyle=yLines]{\spatialResolutionFifty}
\end{pspicture}

\end{document}
Aber gerade der folgende Teil schreckt ein wenig ab.
\pst@def{ScalePointsThreeD}<%
  counttomark dup dup cvi eq not { exch pop } if
  /m exch def /n m 3 div cvi def
  n {             % now we have x y z
    3 -1 roll
    490 sub 2 div % (x-490)/2
    3 1 roll
    exch 2 div % y/2
    exch
    tx@3DPlotDict begin
    saveCoor
    ConvertTo2D
    x2D \pst@number\psxunit mul y2D \pst@number\psyunit mul
    end
    m 1 sub 1 roll m 1 sub 1 roll /m m 3 sub def } repeat>
Woran liegt es denn jetzt vom Befehl her? Ist es dafür nicht vorgesehen, dass Werte fernab des Achsenkreuzes aufgetragen werden?
Gruß,
Klaus.
Bei LaTex führen mir manchmal einfach zu viele Wege nach Rom.

