ich versuch die ganze Zeit ein Diagramm mit pgfplots zumachen.
Daten Liegen so vor:
Dauer      Kraft
00:00:01    15
00:00:25    15,6
00:01:20    15,3
Die Zeiten sind alle Unregelmäßig.
Kann mir jemand Weiterhelfen?
Viele Grüße aus dem Harz

Dauer Kraft 00:00:01 15 00:00:25 15,6 00:01:20 15,3
Dann zeige den Lesern Deines Beitrags in Form eines Beispiels, was Du bisher erreicht hast.typenschild hat geschrieben:ich versuch die ganze Zeit ein Diagramm mit pgfplots zumachen.
date coordinates in=x,
\begin{filecontents*}{data.dat}
Dauer      Kraft
 00:00:01    15
 00:00:25    15,6
 00:01:20    15,3
\end{filecontents*}

\documentclass{article}
\usepackage{pgfplots}
\pgfplotsset{compat=1.12}
\usepgfplotslibrary{dateplot}

\def\transformtime#1:#2:#3!{
%    \pgfkeys{/pgf/fpu=true,/pgf/fpu/output format=fixed}
    \pgfmathparse{#1*3600-\pgfkeysvalueof{/pgfplots/timeplot zero}*3600+#2*60+#3}
%    \pgfkeys{/pgf/fpu=false}
}

\pgfplotsset{
    timeplot zero/.initial=0,
    timeplot/.style={
        x coord trafo/.code={\expandafter\transformtime##1!},
        x coord inv trafo/.code={%
%            \pgfkeys{/pgf/fpu=true,/pgf/fpu/output format=fixed,}
            \pgfmathsetmacro\hours{floor(##1/3600)+\pgfkeysvalueof{/pgfplots/timeplot zero}}
            \pgfmathsetmacro\minutes{floor((##1-(\hours - \pgfkeysvalueof{/pgfplots/timeplot zero})*3600)/60)}
            \pgfmathsetmacro\seconds{##1-floor((##1)/60)*60}
            \def\pgfmathresult{%
              \pgfmathparse{ifthenelse(  \hours<10,0,)}\pgfmathresult\pgfmathprintnumber{\hours}:%
              \pgfmathparse{ifthenelse(\minutes<10,0,)}\pgfmathresult\pgfmathprintnumber{\minutes}:%
              \pgfmathparse{ifthenelse(\seconds<10,0,)}\pgfmathresult\pgfmathprintnumber{\seconds}%
            }
%            \pgfkeys{/pgf/fpu=false}
        },
    scaled x ticks=false,
    xticklabel=\tick,
    x tick label style={rotate=90}
    }
}

\begin{document}
\begin{tikzpicture}
\begin{axis}[
    timeplot, timeplot zero=0, xtick=data,
]
\addplot table[/pgf/number format/read comma as period] {data.dat};
\end{axis}
\end{tikzpicture}
\end{document}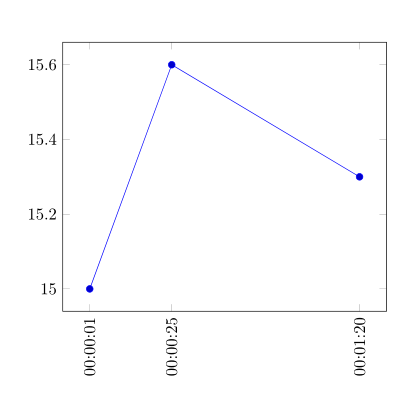
\documentclass[paper=landscape,DIV=40]{scrartcl}
\usepackage{datatool,longtable}
\usepackage{pgfplots}
\pgfplotsset{compat=1.13}
\usepgfplotslibrary{dateplot}
\pgfplotsset{/pgf/number format/use comma,
/pgf/number format/read comma as period}

\begin{filecontents*}{\jobname.dat}
Dauer      Kraft
00:00:01    15
00:00:25    15,6
00:01:20    15,3
\end{filecontents*}

\newcommand*{\mysep}{ }
\DTLsetseparator{ }
\DTLloaddb[noheader,keys={Dauer,Kraft},omitlines=1]{dauerkraft}{\jobname.dat}
\newwrite\plotfile
\immediate\openout\plotfile \jobname.csv
\immediate\write\plotfile{Sekunden\mysep Dauer\mysep Kraft}
\newcommand*\SECONDSOF{}
\def\SECONDSOF#1:#2:#3:{\the\numexpr 3600*#1+60*#2+#3\relax}
\DTLforeach[\NOT\equal{\Dauer}{\csname @dtlstringnull\endcsname}]{dauerkraft}{\Dauer=Dauer,\Kraft=Kraft}{%
  \immediate\write\plotfile{\expandafter\SECONDSOF\Dauer:\mysep\Dauer\mysep\Kraft}%
}
\immediate\closeout\plotfile
\pgfplotstableread{\jobname.csv}\sekundendauerkrafttable

\begin{document}
\begin{tikzpicture}
  \begin{axis}[%
    height=\textheight,
    width=\textwidth,
    xtick=data,
%    x tick label style={rotate=90,anchor=east},
    xticklabels from table={\sekundendauerkrafttable}{Dauer},
    ]%
    \addplot table[x=Sekunden,y=Kraft,xtick=Dauer] {\sekundendauerkrafttable};
  \end{axis}
\end{tikzpicture}
\end{document}Natürlich mit Tabs getrennt, sieht man hier nicht richitgDauer Kraft
00:00:01 21,490365
00:00:17 21,4798313333
00:00:34 21,4662983333
00:00:52 21,4617970000
00:01:09 21,4557646667 <-- Diese Zeile Verursacht den Fehler
00:01:26 21,4482323333
00:01:44 21,4407003333
Und da hätte ich noch was:! Package PGF Math Error: Digit `=' invalid for base 8 (in '00*3600-0*3600+01*6
0+09').
See the PGF Math package documentation for explanation.
Type H <return> for immediate help.
...
l.41 ...r format/read comma as period] {data.dat};
\let
\documentclass[paper=landscape,DIV=40]{scrartcl}
\usepackage{datatool,longtable}
\usepackage{pgfplots}
\pgfplotsset{compat=1.13}
\usepgfplotslibrary{dateplot}
\pgfplotsset{/pgf/number format/use comma,
/pgf/number format/read comma as period}

\begin{filecontents*}{\jobname.dat}
Dauer Kraft
00:00:01 21,490365
00:00:17 21,4798313333
00:00:34 21,4662983333
00:00:52 21,4617970000
00:01:09 21,4557646667
00:01:26 21,4482323333
00:01:44 21,4407003333
\end{filecontents*}

\newcommand*{\mysep}{ }
\DTLsetseparator{ }
\DTLloaddb[noheader,keys={Dauer,Kraft},omitlines=1]{dauerkraft}{\jobname.dat}
\newwrite\plotfile
\immediate\openout\plotfile \jobname.csv
\immediate\write\plotfile{Sekunden\mysep Dauer\mysep Kraft}
\newcommand*\SECONDSOF{}
\def\SECONDSOF#1:#2:#3:{\the\numexpr 3600*#1+60*#2+#3\relax}
\DTLforeach[\NOT\equal{\Dauer}{\csname @dtlstringnull\endcsname}]{dauerkraft}{\Dauer=Dauer,\Kraft=Kraft}{%
\immediate\write\plotfile{\expandafter\SECONDSOF\Dauer:\mysep\Dauer\mysep\Kraft}%
}
\immediate\closeout\plotfile
\pgfplotstableread{\jobname.csv}\sekundendauerkrafttable

\begin{document}
\begin{tikzpicture}
\begin{axis}[%
height=\textheight,
width=\textwidth,
xtick={0,30,...,120},
% x tick label style={rotate=90,anchor=east},
xticklabels={00:00:00,00:00:30,00:01:00,00:30:00,00:02:00}
]%
\addplot table[x=Sekunden,y=Kraft,xtick=Dauer] {\sekundendauerkrafttable};
\end{axis}
\end{tikzpicture}
\end{document}\documentclass[paper=landscape,DIV=40]{scrartcl}
\usepackage{datatool,longtable}
\usepackage{pgfplots}
\pgfplotsset{compat=1.13}
\usepgfplotslibrary{dateplot}
\pgfplotsset{/pgf/number format/use comma,
/pgf/number format/read comma as period}
\begin{filecontents*}{\jobname.dat}
Dauer Kraft
00:00:01 21,490365
00:00:17 21,4798313333
00:00:34 21,4662983333
00:00:52 21,4617970000
00:01:09 21,4557646667
00:01:26 21,4482323333
00:01:44 21,4407003333
\end{filecontents*}
\newcommand*{\mysep}{ }
\DTLsetseparator{ }
\DTLloaddb[noheader,keys={Dauer,Kraft},omitlines=1]{dauerkraft}{\jobname.dat}
\newwrite\plotfile
\immediate\openout\plotfile \jobname.csv
\immediate\write\plotfile{Sekunden\mysep Dauer\mysep Kraft}
\newcommand*\SECONDSOF{}
\def\SECONDSOF#1:#2:#3:{\the\numexpr 3600*#1+60*#2+#3\relax}
\DTLforeach[\NOT\equal{\Dauer}{\csname @dtlstringnull\endcsname}]{dauerkraft}{\Dauer=Dauer,\Kraft=Kraft}{%
\immediate\write\plotfile{\expandafter\SECONDSOF\Dauer:\mysep\Dauer\mysep\Kraft}%
}
\immediate\closeout\plotfile
\pgfplotstableread{\jobname.csv}\sekundendauerkrafttable
\begin{document}
\begin{tikzpicture}
\begin{axis}[%
height=\textheight,
width=\textwidth,
xtick={0,30,...,120},% Abstand der Label (in Sekunden)
% x tick label style={rotate=90,anchor=east},% Label vertikal setzen, falls mehr benötigt werden
xticklabel={\pgfkeys{/pgf/number format/.cd,fixed,precision=0}%
\pgfmathsetmacro\hours{floor(\tick/3600)}%
\pgfmathsetmacro\minutes{floor(\tick/60)-\hours*60}%
\pgfmathsetmacro\seconds{\tick-\minutes*60-\hours*3600}%
\pgfmathparse{ifthenelse(\hours<10,0,)}\pgfmathresult\pgfmathprintnumber{\hours}:%
\pgfmathparse{ifthenelse(\minutes<10,0,)}\pgfmathresult\pgfmathprintnumber{\minutes}:%
\pgfmathparse{ifthenelse(\seconds<10,0,)}\pgfmathresult\pgfmathprintnumber{\seconds}}
]%
\addplot table[x=Sekunden,y=Kraft,xtick=Dauer] {\sekundendauerkrafttable};
\end{axis}
\end{tikzpicture}
\end{document}\documentclass[paper=landscape,DIV=40]{scrartcl}
\usepackage{datatool,longtable}
\usepackage{pgfplots}
\pgfplotsset{compat=1.13}
\usepgfplotslibrary{dateplot}
\pgfplotsset{/pgf/number format/use comma,
/pgf/number format/read comma as period}
\usepackage{filecontents}
\begin{filecontents*}{\jobname.dat}
Dauer Kraft Weg
00:00:01 21,490365 12,0
00:00:17 21,4798313333 12,04
00:00:34 21,4662983333 12,06
00:00:52 21,4617970000 12,10
00:01:09 21,4557646667 12,11
00:01:26 21,4482323333 12,15
00:01:44 21,4407003333 12,19
\end{filecontents*}
\newcommand*{\mysep}{ }
\DTLsetseparator{ }
\DTLloaddb[noheader,keys={Dauer,Kraft,Weg},omitlines=1]{dauerkraft}{\jobname.dat}
\newwrite\plotfile
\immediate\openout\plotfile \jobname.csv
\immediate\write\plotfile{Sekunden\mysep Dauer\mysep Kraft\mysep Weg}
\newcommand*\SECONDSOF{}
\def\SECONDSOF#1:#2:#3:{\the\numexpr 3600*#1+60*#2+#3\relax}
\DTLforeach[\NOT\equal{\Dauer}{\csname @dtlstringnull\endcsname}]{dauerkraft}{\Dauer=Dauer,\Kraft=Kraft,\Weg=Weg}{%
\immediate\write\plotfile{\expandafter\SECONDSOF\Dauer:\mysep\Dauer\mysep\Kraft\mysep\Weg}%
}
\immediate\closeout\plotfile
\pgfplotstableread{\jobname.csv}\sekundendauerkrafttable
\begin{document}
\begin{tikzpicture}
\begin{axis}[%
height=\textheight,
width=\textwidth,
xtick={0,30,...,120},
% x tick label style={rotate=90,anchor=east},
xticklabel={\pgfkeys{/pgf/number format/.cd,fixed,precision=0}%
\pgfmathsetmacro\hours{floor(\tick/3600)}%
\pgfmathsetmacro\minutes{floor(\tick/60)-\hours*60}%
\pgfmathsetmacro\seconds{\tick-\minutes*60-\hours*3600}%
\pgfmathparse{ifthenelse(\hours<10,0,)}\pgfmathresult\pgfmathprintnumber{\hours}:%
\pgfmathparse{ifthenelse(\minutes<10,0,)}\pgfmathresult\pgfmathprintnumber{\minutes}:%
\pgfmathparse{ifthenelse(\seconds<10,0,)}\pgfmathresult\pgfmathprintnumber{\seconds}}
]%
\addplot table[x=Sekunden,y=Kraft] {\sekundendauerkrafttable};% für y die Kraft-Spalte verwenden
\end{axis}
\end{tikzpicture}
\begin{tikzpicture}
\begin{axis}[%
height=\textheight,
width=\textwidth,
xtick={0,30,...,120},
% x tick label style={rotate=90,anchor=east},
xticklabel={\pgfkeys{/pgf/number format/.cd,fixed,precision=0}%
\pgfmathsetmacro\hours{floor(\tick/3600)}%
\pgfmathsetmacro\minutes{floor(\tick/60)-\hours*60}%
\pgfmathsetmacro\seconds{\tick-\minutes*60-\hours*3600}%
\pgfmathparse{ifthenelse(\hours<10,0,)}\pgfmathresult\pgfmathprintnumber{\hours}:%
\pgfmathparse{ifthenelse(\minutes<10,0,)}\pgfmathresult\pgfmathprintnumber{\minutes}:%
\pgfmathparse{ifthenelse(\seconds<10,0,)}\pgfmathresult\pgfmathprintnumber{\seconds}}
]%
\addplot table[x=Sekunden,y=Weg] {\sekundendauerkrafttable};% für y die Weg-Spalte verwenden
\end{axis}
\end{tikzpicture}
\end{document}