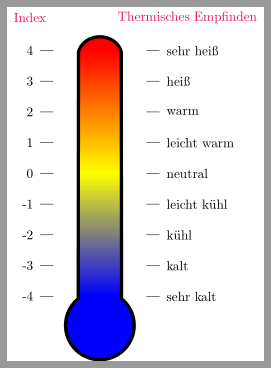
ich habe mir ein Thermometer zurechtgebastelt:
\documentclass{standalone}
%\usepackage[showframe]{geometry}
\usepackage{fourier}
\usepackage[dvipsnames]{xcolor}
\usepackage{tikz}
\begin{document}
\begin{tikzpicture}[y=0.5pt, x=0.5pt,yscale=-1, inner sep=0pt, outer sep=0pt]
\def\thermopath{
  (280.0313,169.3125) .. controls (263.9888,169.3125) and (250.6461,179.3446) ..
  (247.8125,192.5625) --
  (247.3438,563.7500) .. controls (235.7346,573.2243) and (228.3438,587.6282) ..
  (228.3438,603.7813) .. controls (228.3438,632.3161) and (251.4651,655.4688) ..
  (280.0000,655.4688) .. controls (308.5349,655.4688) and (331.6563,632.3161) ..
  (331.6563,603.7813) .. controls (331.6563,587.6282) and (324.2654,573.2243) ..
  (312.6563,563.7500) --
  (312.2500,192.5625) .. controls
  (309.4164,179.3446) and (296.0737,169.3125) .. (280.0313,169.3125) -- cycle
 }
\path[miter limit=4,even odd rule,fill=gray!20]
    \thermopath;

\def\tempincelsius{55}
\begin{scope}
    \clip \thermopath;
    \fill[red] (210,{560- 3.7*\tempincelsius}) -- ++(140,0)
        -- (350, 690) -- (210, 690) -- cycle;
\end{scope}

\path[draw=black,miter limit=4,even odd rule,line width=2.5pt]
    \thermopath;


\foreach \y/\x in {190/4,
                   236.25/3,
                   282.5/2,
                   328.75/1,
                   375/0,
                   421/-1,
                   467.5/-2,
                   513.75/-3,
                   560/-4%
                   }
    {
    \draw (210,\y)--(190,\y) node[left](\x){\x};
    }
\foreach \u/\v in {190/sehr heiss,
                   236.25/heiss,
                   282.5/warm,
                   328.75/leicht warm,
                   375/neutral,
                   421/leicht kühl,
                   467.5/kühl,
                   513.75/kalt,
                   560/sehr kalt%
                   }
    {
    \draw (350,\u)--(370,\u) node[right](\v){\v};
    }


\draw node[xshift=-5em, OrangeRed] at (260,140) {Index};
\draw node[xshift=-5em, OrangeRed] at (500,140) {Thermisches Empfinden};


\end{tikzpicture}
\end{document}Abstand der Wörter (kühl,...) von der Achse. Habe das mit Tilde probiert, es funktioniert, aber es kommt eine Fehlermeldung.
Zusätzlich würde ich gerne das ganze Thermometer füllen und unten mit blau beginnen lassen, dann gelb (neutral) und oben rot haben.
Ist so etwas möglich?
Danke für Euer Feedback