Gruppierte x-Achse in Punktdiagramm

Tabellen und Grafiken erstellen und anordnen


Vaschan
Forum-Fortgeschrittener
Beiträge: 68
Registriert: So 8. Mai 2016, 12:35

Gruppierte x-Achse in Punktdiagramm

Beitrag von Vaschan »

Hallo zusammen,

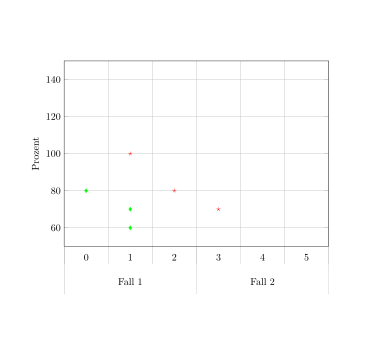
ich würde gerne jeweils drei x-Achsen Punkte zu einem Fall zusmamenfassen wie im Bild dargestellt. Wie kann ich das mit Latex machen?
\documentclass[a4paper]{article}

%% Language and font encodings
\usepackage[english]{babel}
\usepackage[utf8x]{inputenc}
\usepackage[T1]{fontenc}
\usepackage{pgfplots} 
\pgfplotsset{compat=1.14}
\usepackage[a4paper,top=3cm,bottom=2cm,left=3cm,right=3cm,marginparwidth=1.75cm]{geometry}

\begin{document}
\begin{figure}[htb]
	\centering
	\begin{tikzpicture}
	\begin{axis}[
	width=0.9\textwidth,
	height=0.42\textheight,
	xlabel={},
        %symbolic x coords = {Fall 1, Fall 2},
	ylabel={Prozent}, 
	ymajorgrids,
	xmin=0, xmax=4,
	ymin=50, ymax=150, 
	ymajorgrids,
	xmajorgrids
	]	
	\addplot[green, only marks,mark=diamond*] coordinates {(0,80) (1,70) (1,60)};
	\addplot[red, only marks,mark=star] coordinates {(2,80) (3,70) (1,100)};
	\end{axis}
	\end{tikzpicture}
	\caption{Bruch}
\end{figure}
\end{document}
Dateianhänge
So soll es aussehen
So soll es aussehen
BildLatex.png (3.35 KiB) 1812 mal betrachtet

Vaschan
Forum-Fortgeschrittener
Beiträge: 68
Registriert: So 8. Mai 2016, 12:35

Beitrag von Vaschan »

Hat keiner eine Idee?

esdd
Forum-Meister
Forum-Meister
Beiträge: 2561
Registriert: So 7. Feb 2010, 16:36

Beitrag von esdd »

Vorschlag:
\documentclass{article}
\usepackage{pgfplots} 
\pgfplotsset{compat=1.14}% aktuell wäre 1.16

\begin{document} 
\begin{tikzpicture} 
  \begin{axis}[ 
    width=0.9\textwidth, 
    height=0.42\textheight, 
    xlabel={},
    ylabel={Prozent}, 
    ymajorgrids, 
    xmin=-0.5, xmax=5.5, 
    ymin=50, ymax=150, 
    minor x tick num=1,
    major x tick style={draw=none},
    minor x tick style={/pgfplots/minor tick length=1.5\baselineskip},
    xtick pos=lower,
    xtick align=outside,
    xminorgrids,
    extra x ticks={1,4},
    extra x tick labels={Fall 1, Fall 2},
    extra x tick style={ticklabel style={yshift=-2\baselineskip}},
  ]
  \addplot[green, only marks,mark=diamond*] coordinates {(0,80) (1,70) (1,60)}; 
  \addplot[red, only marks,mark=star] coordinates {(2,80) (3,70) (1,100)};
  \pgfplotsinvokeforeach{0,...,2}{\coordinate(c#1) at ({-.5+#1*3},0|-current axis.south);}
  \end{axis}
  \foreach \i in {0,...,2}\draw[help lines](c\i)--+(0,-4*\baselineskip);
\end{tikzpicture} 
\end{document}
Bild
Dateianhänge
gl_gruppierterplot.png
gl_gruppierterplot.png (6.69 KiB) 1854 mal betrachtet

Vaschan
Forum-Fortgeschrittener
Beiträge: 68
Registriert: So 8. Mai 2016, 12:35

Beitrag von Vaschan »

Vielen Dank für die Antwort!

Wäre es auch möglich statt 1,2,3,4,5.. I, II, III, I, II, III zu schreiben auf der Achse? Bzw wenn das nicht möglich ist die werte einfach auszublenden? für mich ist die Unterscheidung in Fall 1 und Fall 2 wichtiger als die oberen Ticks.

extra x tick style={rotate=45,anchor=north east, text width=5cm,align=left},
Dieser Befehl funktioniert leider auch nicht so wie ich mir das vorstelle
Zuletzt geändert von Vaschan am Mi 18. Jul 2018, 12:52, insgesamt 2-mal geändert.

Gast

Beitrag von Gast »

Das ist keine Rückfrage sondern eine neue Frage oder eine Ergänzungsfrage.

esdd
Forum-Meister
Forum-Meister
Beiträge: 2561
Registriert: So 7. Feb 2010, 16:36

Beitrag von esdd »

Vaschan hat geschrieben: Wäre es auch möglich statt 1,2,3,4,5.. I, II, III, I, II, III zu schreiben auf der Achse? Bzw wenn das nicht möglich ist die werte einfach auszublenden? für mich ist die Unterscheidung in Fall 1 und Fall 2 wichtiger als die oberen Ticks.
Beispielsweise:
\documentclass{article} 
\usepackage{pgfplots} 
\pgfplotsset{compat=1.14}% aktuell wäre 1.16 

\begin{document} 
\begin{tikzpicture} 
  \begin{axis}[ 
    width=0.9\textwidth, 
    height=0.42\textheight, 
    xlabel={}, 
    ylabel={Prozent}, 
    ymajorgrids, 
    xmin=-0.5, xmax=5.5, 
    ymin=50, ymax=150, 
    xtick={0,1,...,100},% <- eingefügt
    xticklabel={\pgfmathparse{int(mod(\tick,3)+1)}\romannumeral\pgfmathresult},% <- eingefügt
    minor x tick num=1, 
    major x tick style={draw=none}, 
    minor x tick style={/pgfplots/minor tick length=1.5\baselineskip}, 
    xtick pos=lower, 
    xtick align=outside, 
    xminorgrids, 
    extra x ticks={1,4}, 
    extra x tick labels={Fall 1, Fall 2}, 
    extra x tick style={ticklabel style={yshift=-2\baselineskip}},
  ] 
  \addplot[green, only marks,mark=diamond*] coordinates {(0,80) (1,70) (1,60)}; 
  \addplot[red, only marks,mark=star] coordinates {(2,80) (3,70) (1,100)}; 
  \pgfplotsinvokeforeach{0,...,2}{\coordinate(c#1) at ({-.5+#1*3},0|-current axis.south);} 
  \end{axis} 
  \foreach \i in {0,...,2}\draw[help lines](c\i)--+(0,-4*\baselineskip); 
\end{tikzpicture} 
\end{document}
Vaschan hat geschrieben:
extra x tick style={rotate=45,anchor=north east, text width=5cm,align=left},
Dieser Befehl funktioniert leider auch nicht so wie ich mir das vorstelle
Schau Dir doch an, wie ich die zusätzliche Beschriftung der x-Achse nach unten verschoben habe. Und damit Du besser beurteilen kannst, ob text width=5cm,align=left sinnvoll ist, ergänze vorübergehend ein draw.
extra x tick style={ticklabel style={anchor=north east,rotate=45, text width=5cm,align=left,draw}}

Vaschan
Forum-Fortgeschrittener
Beiträge: 68
Registriert: So 8. Mai 2016, 12:35

Beitrag von Vaschan »

Vielen Dank funktioniert

Antworten