Simon Belka hat geschrieben:
\draw [color=blue, thick, domain=-1:1] plot (\x,{((\x)-4)^2}) node[right] {$f$};
Mit domain=-1:1 legst Du den x-Bereich fest, für den die Funktion geplottet wird. Nun ist aber f(-1)=25 und f(1)=9 während Dein Koordinatensystem bei y=5 endet. Damit ist klar, dass der Plot oberhalb Deines Koordinatensystems liegen muss.
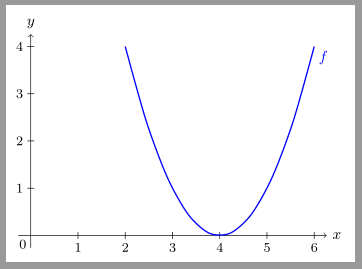
Da der Scheitelpunkt der Parabel mit f(x)=(x-4)^2 bei (4,0) liegt, wäre vermutlich etwas wie domain=2:6 sinnvoll, wobei die x-Achse etwas verlängert werden müsste.
Hier ist ein Vorschlag für die Anpassung Deines Codes und ein weiterer mit der von
pgfplots bereitgestellten axis-Umgebung:
\documentclass[margin=5pt]{standalone}
\usepackage{pgfplots}% lädt auch tikz etc.
\pgfplotsset{compat=newest}
\begin{document}
\begin{tikzpicture}

%Nummerierung
\foreach \x in {1,...,6}
  \draw [xshift=\x cm] (0,2pt) -- (0,-2pt)
  node [below] {$\x$};

\foreach \y in {-4,...,4}
  \draw [yshift=\y cm] (2pt, 0) -- (-2pt,0)
  node [left] {\ifnum\y=0\else$\y$\fi};

%Achsen
\draw [->, thick] (-1,0) -- (7,0) node[right] {$x$};
\draw [->, thick] (0, -5) -- (0,5) node[above] {$f(x)$};

%f
\draw [color=blue, thick, domain=2:6] plot (\x,{(\x-4)^2}) node[right] {$f$};

\end{tikzpicture}
\qquad
\begin{tikzpicture}
  \begin{axis}[
    axis lines=middle,
    x=1cm,y=1cm,
    xmin=-1,xmax=7,
    xtick={1,...,6},
    ymin=-5,ymax=5,
    ytick={-4,...,4},
    xlabel=$x$,xlabel style={right},
    ylabel=$f(x)$,ylabel style={above}
    ]
    \addplot[blue,thick,domain=2:6]{(x-4)^2}node[right]{$f$};
  \end{axis}
\end{tikzpicture}
\end{document}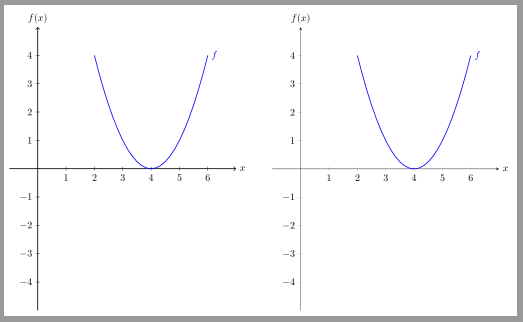
Oder mit der datavisualization.formats.functions Bibliothek:
\documentclass[margin=5pt]{standalone}
\usepackage{tikz}
\usetikzlibrary{datavisualization.formats.functions}
\begin{document}
\begin{tikzpicture}
\datavisualization[
  school book axes,
  all axes={unit length=1cm},
  x axis={label=$x$},
  y axis={label=$y$},
  visualize as smooth line,
  visualizer options/style={blue,thick},
  visualizer options/label in data={text'=$f$, when=x is 6,node style=blue}
  ]
  data [format=function] {
    var x : interval [2:6] samples 10;
    func y = (\value x - 4)*(\value x -4);
  };
\end{tikzpicture}
\end{document}