von Eduard » Mo 2. Dez 2019, 13:54
Hallo zusammen,
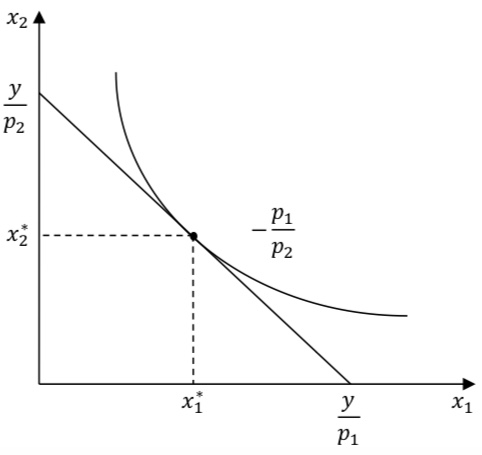
ich würde gerne die angehängt Funktion zeichnen. Leider kenne ich mich tikzpicture gar nicht aus. Habe folgendes gefunden, weiß aber nicht, wie ich das Ganze so verändern kann, damit meine gewünschte Funktion rauskommt.
\documentclass{minimal}
\usepackage{tikz}
\usetikzlibrary{arrows}
\begin{document}
\begin{tikzpicture}[
    scale=5,
    axis/.style={very thick, ->, >=stealth'},
    important line/.style={thick},
    dashed line/.style={dashed, thin},
    pile/.style={thick, ->, >=stealth', shorten <=2pt, shorten
    >=2pt},
    every node/.style={color=black}
    ]
    % axis
    \draw[axis] (-0.1,0)  -- (1.1,0) node(xline)[right]
        {$x_2$};
    \draw[axis] (0,-0.1) -- (0,1.1) node(yline)[above] {$x_1$};
    % Lines
    \draw[important line] (.15,.15) coordinate (A) -- (.85,.85)
        coordinate (B) node[right, text width=5em] {$Y^O$};
    \draw[important line] (.0,.85) coordinate (C) -- (.85,.15)
        coordinate (D) node[right, text width=7em] {$\mathit{NX}=x$};
    % Intersection of lines
    \fill[red] (intersection cs:
       first line={(A) -- (B)},
       second line={(C) -- (D)}) coordinate (E) circle (.4pt)
       node[above,] {$A$};
    % The E point is placed more or less randomly
    \fill[red]  (E) +(-.075cm,-.2cm) coordinate (out) circle (.4pt)
        node[below left] {$B$};
    % Line connecting out and ext balances
    \draw [pile] (out) -- (intersection of A--B and out--[shift={(0:1pt)}]out)
        coordinate (extbal);
    \fill[red] (extbal) circle (.4pt) node[above] {$C$};
    % line connecting  out and int balances
    \draw [pile] (out) -- (intersection of C--D and out--[shift={(0:1pt)}]out)
        coordinate (intbal);
    \fill[red] (intbal) circle (.4pt) node[above] {$D$};
    % line between out og all balanced out :)
    \draw[pile] (out) -- (E);
\end{tikzpicture}
\end{document}
Wäre super, falls mir jemand kurz sagen könnte, wie ich das hinbekommen. Vielen Dank!
- Dateianhänge
-
- GL1.jpeg (28.1 KiB) 7021 mal betrachtet
Hallo zusammen,
ich würde gerne die angehängt Funktion zeichnen. Leider kenne ich mich tikzpicture gar nicht aus. Habe folgendes gefunden, weiß aber nicht, wie ich das Ganze so verändern kann, damit meine gewünschte Funktion rauskommt.
[code]
\documentclass{minimal}
\usepackage{tikz}
\usetikzlibrary{arrows}
\begin{document}
\begin{tikzpicture}[
scale=5,
axis/.style={very thick, ->, >=stealth'},
important line/.style={thick},
dashed line/.style={dashed, thin},
pile/.style={thick, ->, >=stealth', shorten <=2pt, shorten
>=2pt},
every node/.style={color=black}
]
% axis
\draw[axis] (-0.1,0) -- (1.1,0) node(xline)[right]
{$x_2$};
\draw[axis] (0,-0.1) -- (0,1.1) node(yline)[above] {$x_1$};
% Lines
\draw[important line] (.15,.15) coordinate (A) -- (.85,.85)
coordinate (B) node[right, text width=5em] {$Y^O$};
\draw[important line] (.0,.85) coordinate (C) -- (.85,.15)
coordinate (D) node[right, text width=7em] {$\mathit{NX}=x$};
% Intersection of lines
\fill[red] (intersection cs:
first line={(A) -- (B)},
second line={(C) -- (D)}) coordinate (E) circle (.4pt)
node[above,] {$A$};
% The E point is placed more or less randomly
\fill[red] (E) +(-.075cm,-.2cm) coordinate (out) circle (.4pt)
node[below left] {$B$};
% Line connecting out and ext balances
\draw [pile] (out) -- (intersection of A--B and out--[shift={(0:1pt)}]out)
coordinate (extbal);
\fill[red] (extbal) circle (.4pt) node[above] {$C$};
% line connecting out and int balances
\draw [pile] (out) -- (intersection of C--D and out--[shift={(0:1pt)}]out)
coordinate (intbal);
\fill[red] (intbal) circle (.4pt) node[above] {$D$};
% line between out og all balanced out :)
\draw[pile] (out) -- (E);
\end{tikzpicture}
\end{document}
[/code]
Wäre super, falls mir jemand kurz sagen könnte, wie ich das hinbekommen. Vielen Dank!