von herrmann_wst » Do 11. Apr 2019, 14:46
Hallo zusammen,
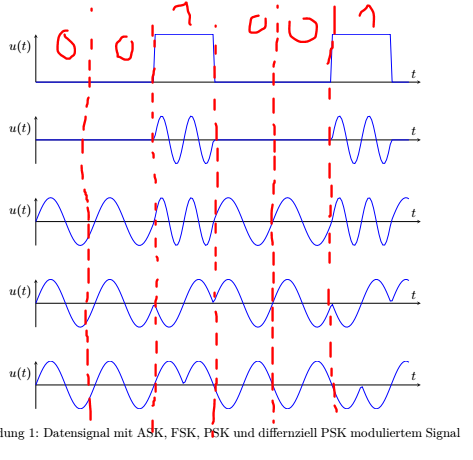
ich bin latex Anfänger und versuche nun schon seit längerem senkrechte linien über mehrere Graphen hinweg zu zeichenen, bisher leider ohne Erfolg. Das Bild zeigt grob was ich vor habe. Hier mein Code dazu:
\pgfplotsset{width=13cm, height=3cm}

\begin{figure}
  \centering
	\begin{tikzpicture}[
  		declare function={
    		func(\x)= (\x < 2) * (0) + and(\x >= 2, \x < 3) * (1) + and(\x >= 3, \x < 5) * (0) + and(\x >= 5, \x < 6) * (1) + (\x >= 6) * (0);
  			}
		]
	\begin{axis}[
  	axis x line=middle, axis y line=middle,
  	y label style={at={(axis description cs:-0.04,.5)},anchor=south},
  	ymin=0, ymax=1, ytick={0,0}, ylabel=$u(t)$,
  	xmin=0, xmax=6.5, xtick={0,0}, xlabel=$t$,
  	domain=0:6.3,samples=201,
	]

	\addplot [blue,thick] {func(x)};
	\end{axis}
	\end{tikzpicture}

\ \\
\ \\

\begin{tikzpicture}[
  	declare function={
    	func(\x)= (\x < 2) * (0) + and(\x >= 2, \x < 3) * (sin(\x * 57.2958 * pi * 2 * 2)) + and(\x >= 3, \x < 5) * (0) + and(\x >= 5, \x < 6) * (sin(\x * 57.2958 * pi * 4)) + (\x >= 6) * 0;
  		}
	]

	\begin{axis}[
  	axis x line=middle, axis y line=middle,
  y label style={at={(axis description cs:-0.04,.5)},anchor=south},
  	ymin=-1, ymax=1, ytick={0,0}, ylabel=$u(t)$,
  	xmin=0, xmax=6.5, xtick={0,0}, xlabel=$t$,
  	domain=0:6.3,samples=201,
	]

	\addplot [blue,thick] {func(x)};
	\end{axis}
	\end{tikzpicture}


\ \\
\ \\


\begin{tikzpicture}[
  		declare function={
   			func(\x)= (\x < 2) * (sin(\x * 57.2958 * pi * 2)) + and(\x >= 2, \x < 3) * (sin(\x * 57.2958 * pi * 2 * 2)) + and(\x >= 3, \x < 5) * (sin(\x * 57.2958 * pi * 2)) + and(\x >= 5, \x < 6) * (sin(\x * 57.2958 * pi * 4)) + (\x >= 6) * (sin(\x * 57.2958 * pi * 2));
  		}
]

\begin{axis}[
  axis x line=middle, axis y line=middle,
  y label style={at={(axis description cs:-0.04,.5)},anchor=south},
  ymin=-1, ymax=1, ytick={0,0}, ylabel=$u(t)$,
  xmin=0, xmax=6.5, xtick={0,0}, xlabel=$t$,
  domain=0:6.3,samples=201,
]

\addplot [blue,thick] {func(x)};
\end{axis}
\end{tikzpicture}

\ \\
\ \\


\begin{tikzpicture}[
  		declare function={
   			func(\x)= (\x < 2) * (sin(\x * 57.2958 * pi * 2)) + and(\x >= 2, \x < 3) * (sin(\x * 57.2958 * pi * 2 + 180)) + and(\x >= 3, \x < 5) * (sin(\x * 57.2958 * pi * 2)) + and(\x >= 5, \x < 6) * (sin(\x * 57.2958 * pi * 2 + 180)) + (\x >= 6) * (sin(\x * 57.2958 * pi * 2));
  		}
]

\begin{axis}[
  axis x line=middle, axis y line=middle,
  y label style={at={(axis description cs:-0.04,.5)},anchor=south},
  ymin=-1, ymax=1, ytick={0,0}, ylabel=$u(t)$,
  xmin=0, xmax=6.5, xtick={0,0}, xlabel=$t$,
  domain=0:6.3,samples=201,
]

\addplot [blue,thick] {func(x)};
\end{axis}
\end{tikzpicture}

\ \\
\ \\


\begin{tikzpicture}[
  		declare function={
   			func(\x)= (\x < 2.5) * (sin(\x * 57.2958 * pi * 2)) + and(\x >= 2.5, \x < 5.5) * (sin(\x * 57.2958 * pi * 2 + 180)) + (\x >= 5.5) * (sin(\x * 57.2958 * pi * 2));
  		}
]

\begin{axis}[
  axis x line=middle, axis y line=middle,
  y label style={at={(axis description cs:-0.04,.5)},anchor=south},
  ymin=-1, ymax=1, ytick={0,0}, ylabel=$u(t)$,
  xmin=0, xmax=6.5, xtick={0,0}, xlabel=$t$,
  domain=0:6.3,samples=201,
]

\addplot [blue,thick] {func(x)};
\end{axis}
\end{tikzpicture}

\caption{Datensignal mit ASK, FSK, PSK und differnziell PSK moduliertem Signal}\label{fig:modulation}
\end{figure}
ist nicht unbedingt schön, aber tut größtenteils was es soll

Die Frage ist nun nur noch: wie bekomme ich die linien da rein?
MfG
Philipp
- Dateianhänge
-
- linien.PNG (37.17 KiB) 1633 mal betrachtet
Hallo zusammen,
ich bin latex Anfänger und versuche nun schon seit längerem senkrechte linien über mehrere Graphen hinweg zu zeichenen, bisher leider ohne Erfolg. Das Bild zeigt grob was ich vor habe. Hier mein Code dazu:
[code]
\pgfplotsset{width=13cm, height=3cm}
\begin{figure}
\centering
\begin{tikzpicture}[
declare function={
func(\x)= (\x < 2) * (0) + and(\x >= 2, \x < 3) * (1) + and(\x >= 3, \x < 5) * (0) + and(\x >= 5, \x < 6) * (1) + (\x >= 6) * (0);
}
]
\begin{axis}[
axis x line=middle, axis y line=middle,
y label style={at={(axis description cs:-0.04,.5)},anchor=south},
ymin=0, ymax=1, ytick={0,0}, ylabel=$u(t)$,
xmin=0, xmax=6.5, xtick={0,0}, xlabel=$t$,
domain=0:6.3,samples=201,
]
\addplot [blue,thick] {func(x)};
\end{axis}
\end{tikzpicture}
\ \\
\ \\
\begin{tikzpicture}[
declare function={
func(\x)= (\x < 2) * (0) + and(\x >= 2, \x < 3) * (sin(\x * 57.2958 * pi * 2 * 2)) + and(\x >= 3, \x < 5) * (0) + and(\x >= 5, \x < 6) * (sin(\x * 57.2958 * pi * 4)) + (\x >= 6) * 0;
}
]
\begin{axis}[
axis x line=middle, axis y line=middle,
y label style={at={(axis description cs:-0.04,.5)},anchor=south},
ymin=-1, ymax=1, ytick={0,0}, ylabel=$u(t)$,
xmin=0, xmax=6.5, xtick={0,0}, xlabel=$t$,
domain=0:6.3,samples=201,
]
\addplot [blue,thick] {func(x)};
\end{axis}
\end{tikzpicture}
\ \\
\ \\
\begin{tikzpicture}[
declare function={
func(\x)= (\x < 2) * (sin(\x * 57.2958 * pi * 2)) + and(\x >= 2, \x < 3) * (sin(\x * 57.2958 * pi * 2 * 2)) + and(\x >= 3, \x < 5) * (sin(\x * 57.2958 * pi * 2)) + and(\x >= 5, \x < 6) * (sin(\x * 57.2958 * pi * 4)) + (\x >= 6) * (sin(\x * 57.2958 * pi * 2));
}
]
\begin{axis}[
axis x line=middle, axis y line=middle,
y label style={at={(axis description cs:-0.04,.5)},anchor=south},
ymin=-1, ymax=1, ytick={0,0}, ylabel=$u(t)$,
xmin=0, xmax=6.5, xtick={0,0}, xlabel=$t$,
domain=0:6.3,samples=201,
]
\addplot [blue,thick] {func(x)};
\end{axis}
\end{tikzpicture}
\ \\
\ \\
\begin{tikzpicture}[
declare function={
func(\x)= (\x < 2) * (sin(\x * 57.2958 * pi * 2)) + and(\x >= 2, \x < 3) * (sin(\x * 57.2958 * pi * 2 + 180)) + and(\x >= 3, \x < 5) * (sin(\x * 57.2958 * pi * 2)) + and(\x >= 5, \x < 6) * (sin(\x * 57.2958 * pi * 2 + 180)) + (\x >= 6) * (sin(\x * 57.2958 * pi * 2));
}
]
\begin{axis}[
axis x line=middle, axis y line=middle,
y label style={at={(axis description cs:-0.04,.5)},anchor=south},
ymin=-1, ymax=1, ytick={0,0}, ylabel=$u(t)$,
xmin=0, xmax=6.5, xtick={0,0}, xlabel=$t$,
domain=0:6.3,samples=201,
]
\addplot [blue,thick] {func(x)};
\end{axis}
\end{tikzpicture}
\ \\
\ \\
\begin{tikzpicture}[
declare function={
func(\x)= (\x < 2.5) * (sin(\x * 57.2958 * pi * 2)) + and(\x >= 2.5, \x < 5.5) * (sin(\x * 57.2958 * pi * 2 + 180)) + (\x >= 5.5) * (sin(\x * 57.2958 * pi * 2));
}
]
\begin{axis}[
axis x line=middle, axis y line=middle,
y label style={at={(axis description cs:-0.04,.5)},anchor=south},
ymin=-1, ymax=1, ytick={0,0}, ylabel=$u(t)$,
xmin=0, xmax=6.5, xtick={0,0}, xlabel=$t$,
domain=0:6.3,samples=201,
]
\addplot [blue,thick] {func(x)};
\end{axis}
\end{tikzpicture}
\caption{Datensignal mit ASK, FSK, PSK und differnziell PSK moduliertem Signal}\label{fig:modulation}
\end{figure}
[/code]
ist nicht unbedingt schön, aber tut größtenteils was es soll :)
Die Frage ist nun nur noch: wie bekomme ich die linien da rein?
MfG
Philipp