von esdd » So 27. Aug 2017, 20:43
Zunächst solltest Du Dir unbedingt
Was bedeutet die Kompatibilitätsangabe "compat=..." bei pgfplots?. Die derzeit aktuelle
pgfplots Version ist eigentlich 1.15. Damit auch der Overleaf-Link funktioniert, verwende ich in dem folgenden Beispiel aber 1.14.
Seit Version 1.11 ist axis cs das Standardkoordinatensystem der axis Umgebung.
In Deinem Beispiel kannst Du immer die komplette Achse als Pfad verwenden und da die Geraden die Achsen schneiden, brauchst Du nicht mal soft clip:
\documentclass[margin=10pt]{standalone}
\usepackage{pgfplots}
\pgfplotsset{compat=1.14}% <- immer compat setzen!
\usepgfplotslibrary{fillbetween}
\begin{document}
\begin{tikzpicture}
\begin{axis}[
  domain=0:100,% geändert
  %samples=400,% für Geraden würde sogar samples=2 reichen
  xmin=0, xmax=100,
  ymin=0, ymax=100,
  xlabel = $x~Achse$, ylabel = $y~Achse$
]
\path[name path=axisy] (0,100) -- (100,100);
\path[name path=axisx] (0,0) -- (100,0);
\addplot+[mark=none, name path=A] {\x+30}
  node[above, rotate=40] at (20,70) {$Instabil$}
  node[above, color= black, rotate=40] at (50,40) {$Stabil$}
;
\addplot+[mark=none, name path=B] {\x-30}
  node[below, rotate=40] at (75,20) {$Instabil$}
;

\addplot [blue,fill opacity=0.05]
  fill between[of=A and axisy]
;
\addplot [red,fill opacity=0.05]
  fill between[of=B and axisx]
;
\end{axis}
\end{tikzpicture}
\end{document}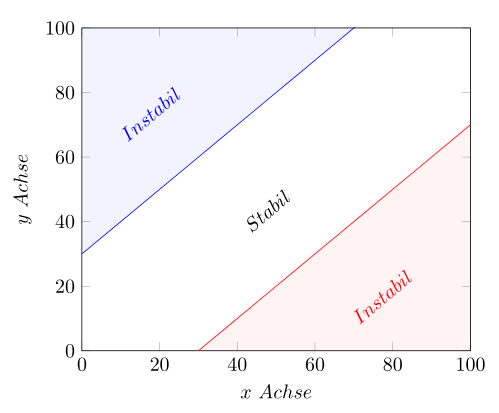
- Dateianhänge
-

- gl_fillbetween.png (20.62 KiB) 2183 mal betrachtet
Zunächst solltest Du Dir unbedingt [url=http://texwelt.de/wissen/antwort_link/19170/]Was bedeutet die Kompatibilitätsangabe "compat=..." bei pgfplots?[/url]. Die derzeit aktuelle [p]pgfplots[/p] Version ist eigentlich 1.15. Damit auch der Overleaf-Link funktioniert, verwende ich in dem folgenden Beispiel aber 1.14.
Seit Version 1.11 ist [tt]axis cs[/tt] das Standardkoordinatensystem der [tt]axis[/tt] Umgebung.
In Deinem Beispiel kannst Du immer die komplette Achse als Pfad verwenden und da die Geraden die Achsen schneiden, brauchst Du nicht mal [tt]soft clip[/tt]:
[code]\documentclass[margin=10pt]{standalone}
\usepackage{pgfplots}
\pgfplotsset{compat=1.14}% <- immer compat setzen!
\usepgfplotslibrary{fillbetween}
\begin{document}
\begin{tikzpicture}
\begin{axis}[
domain=0:100,% geändert
%samples=400,% für Geraden würde sogar samples=2 reichen
xmin=0, xmax=100,
ymin=0, ymax=100,
xlabel = $x~Achse$, ylabel = $y~Achse$
]
\path[name path=axisy] (0,100) -- (100,100);
\path[name path=axisx] (0,0) -- (100,0);
\addplot+[mark=none, name path=A] {\x+30}
node[above, rotate=40] at (20,70) {$Instabil$}
node[above, color= black, rotate=40] at (50,40) {$Stabil$}
;
\addplot+[mark=none, name path=B] {\x-30}
node[below, rotate=40] at (75,20) {$Instabil$}
;
\addplot [blue,fill opacity=0.05]
fill between[of=A and axisy]
;
\addplot [red,fill opacity=0.05]
fill between[of=B and axisx]
;
\end{axis}
\end{tikzpicture}
\end{document}[/code]
[img]http://golatex.de/files/gl_fillbetween_203.png[/img]