von esdd » Sa 2. Jul 2016, 23:28
Wenn ich Dich richtig verstanden habe, möchtest Du etwas wie
\documentclass{scrbook}
\usepackage[T1]{fontenc}
\usepackage[utf8]{inputenc}
\usepackage{subcaption}
\usepackage{tikz}
\definecolor{Grun}{RGB}{155 187 89}
\definecolor{Rot}{RGB}{192 80 77}
\definecolor{Blau}{RGB}{79 129 189}
\definecolor{Lila}{RGB}{128 100 162}
\newcommand*\firststartangle{0}
\newcommand*\radius{3}
\makeatletter
\newcommand\@piechart[1]{%
\begin{tikzpicture}
\foreach [
remember=\endangle as \startangle (initially \firststartangle),
evaluate={\endangle=\startangle+3.6*\percent},
evaluate={\midangle=.5*(\startangle+\endangle)}
] \percent/\name/\color in {#1}{
\draw[fill={\color!80},draw={\color}]
(0,0) -- (\startangle:\radius) arc (\startangle:\endangle:\radius) -- cycle;
\node[pin=\midangle:\percent\%] at (\midangle:\radius) {};
};
\end{tikzpicture}%
}
\newcommand*\piechart[1]{\expandafter\@piechart\expandafter{#1}}
\newcommand\@piechartlegend[1]{%
\foreach \percent/\name/\color in {#1}{
\begin{tikzpicture}[baseline]
\node[fill=\color,minimum size=1.5ex,anchor=west](color){};
\node[anchor=west] at (color.east) {\strut\name};
\end{tikzpicture}
}%
}
\newcommand*\piechartlegend[1]{\expandafter\@piechartlegend\expandafter{#1}}
\makeatother
\begin{document}
\begin{center}
\begin{minipage}{\linewidth}
\captionsetup{type=figure}
\centering
\renewcommand*\radius{2}
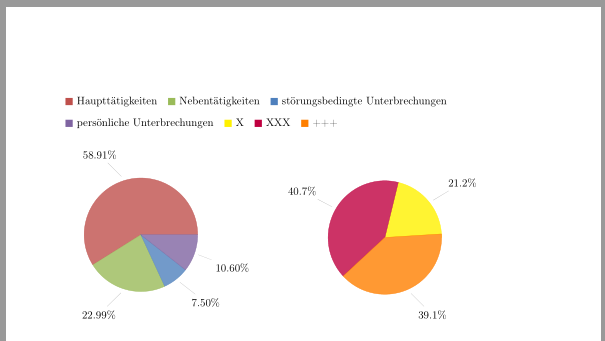
\newcommand\firstpiechartlist{
58.91/Haupttätigkeiten/Rot,
22.99/Nebentätigkeiten/Grun,
7.50/störungsbedingte Unterbrechungen/Blau,
10.60/persönliche Unterbrechungen/Lila%
}
\newcommand\secondpiechartlist{
21.2/X/yellow,
40.7/XXX/purple,
39.1/+++/orange%
}
\begin{flushleft}
\piechartlegend{\firstpiechartlist}%
\piechartlegend{\secondpiechartlist}
\end{flushleft}
\begin{subfigure}[b]{0.48\textwidth}
\centering
\piechart{\firstpiechartlist}
\end{subfigure}%
\hfill
\begin{subfigure}[b]{0.48\textwidth}
\centering
\piechart{\secondpiechartlist}
\end{subfigure}
\end{minipage}
\end{center}
\end{document}
Die Kommentarzeichen (%) sind in dem Beispiel an allen Stellen notwendig. Sie verhindern an der jeweiligen Stelle, dass durch das Zeilenende ein Leerzeichen eingefügt wird.
Und übrigens ist legend columns=-1 eine Option von pgfplots, die Du nur für eine axis Umgebung verwenden kannst.
- Dateianhänge
-

- gl_kreisdiagrammlegende.png (19.87 KiB) 6019 mal betrachtet
Wenn ich Dich richtig verstanden habe, möchtest Du etwas wie
[img]http://golatex.de/files/gl_kreisdiagrammlegende_100.png[/img]
[code]\documentclass{scrbook}
\usepackage[T1]{fontenc}
\usepackage[utf8]{inputenc}
\usepackage{subcaption}
\usepackage{tikz}
\definecolor{Grun}{RGB}{155 187 89}
\definecolor{Rot}{RGB}{192 80 77}
\definecolor{Blau}{RGB}{79 129 189}
\definecolor{Lila}{RGB}{128 100 162}
\newcommand*\firststartangle{0}
\newcommand*\radius{3}
\makeatletter
\newcommand\@piechart[1]{%
\begin{tikzpicture}
\foreach [
remember=\endangle as \startangle (initially \firststartangle),
evaluate={\endangle=\startangle+3.6*\percent},
evaluate={\midangle=.5*(\startangle+\endangle)}
] \percent/\name/\color in {#1}{
\draw[fill={\color!80},draw={\color}]
(0,0) -- (\startangle:\radius) arc (\startangle:\endangle:\radius) -- cycle;
\node[pin=\midangle:\percent\%] at (\midangle:\radius) {};
};
\end{tikzpicture}%
}
\newcommand*\piechart[1]{\expandafter\@piechart\expandafter{#1}}
\newcommand\@piechartlegend[1]{%
\foreach \percent/\name/\color in {#1}{
\begin{tikzpicture}[baseline]
\node[fill=\color,minimum size=1.5ex,anchor=west](color){};
\node[anchor=west] at (color.east) {\strut\name};
\end{tikzpicture}
}%
}
\newcommand*\piechartlegend[1]{\expandafter\@piechartlegend\expandafter{#1}}
\makeatother
\begin{document}
\begin{center}
\begin{minipage}{\linewidth}
\captionsetup{type=figure}
\centering
\renewcommand*\radius{2}
\newcommand\firstpiechartlist{
58.91/Haupttätigkeiten/Rot,
22.99/Nebentätigkeiten/Grun,
7.50/störungsbedingte Unterbrechungen/Blau,
10.60/persönliche Unterbrechungen/Lila%
}
\newcommand\secondpiechartlist{
21.2/X/yellow,
40.7/XXX/purple,
39.1/+++/orange%
}
\begin{flushleft}
\piechartlegend{\firstpiechartlist}%
\piechartlegend{\secondpiechartlist}
\end{flushleft}
\begin{subfigure}[b]{0.48\textwidth}
\centering
\piechart{\firstpiechartlist}
\end{subfigure}%
\hfill
\begin{subfigure}[b]{0.48\textwidth}
\centering
\piechart{\secondpiechartlist}
\end{subfigure}
\end{minipage}
\end{center}
\end{document}
[/code]
Die Kommentarzeichen ([tt]%[/tt]) sind in dem Beispiel an allen Stellen notwendig. Sie verhindern an der jeweiligen Stelle, dass durch das Zeilenende ein Leerzeichen eingefügt wird.
Und übrigens ist [tt]legend columns=-1[/tt] eine Option von [tt]pgfplots[/tt], die Du nur für eine [tt]axis[/tt] Umgebung verwenden kannst.