von esdd » Do 7. Jul 2016, 23:17
Mit ein paar Änderungen im Code und einer utf8 statt utf16 kodierten Datei test.txt

Code:
\documentclass[12pt]{scrreprt}
\usepackage[ngerman]{babel}
\usepackage{pgfplots}% lädt auch tikz
\pgfplotsset{
compat=1.12,
/pgf/number format/.cd,use comma%
}
\begin{document}
\begin{figure}
\centering
\begin{tikzpicture}
%
\begin{axis}[axis x line=bottom, axis y line=left,
xlabel= Zeit ,
xmin=0, xmax= 20000,
ylabel= einheit,
ymin=0, ymax=25,
xtick={0,1800,3600,5400,7200,9000,10800,12600,14400,16200,18000,20800},
xticklabel={{%
\pgfkeys{/pgf/fpu}%
\pgfmathdivide{\tick}{60}%
\pgfmathprintnumber[precision=0]{\pgfmathresult}%
}},
scaled ticks=false,
width=0.9\textwidth, height=5cm,
]
\addplot[mark=, color=blue, smooth] table{test.txt};
\end{axis}
%
\end{tikzpicture}
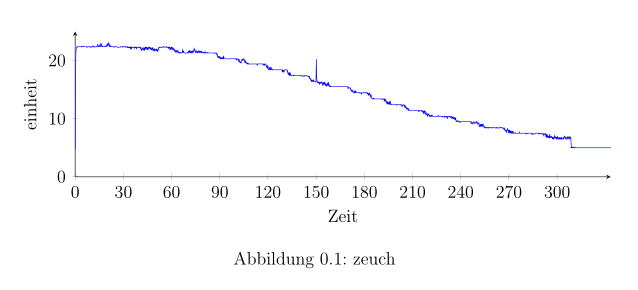
\caption{zeuch}
\label{pic:abc}
\end{figure}
\end{document}
Alternative kann man auch die Daten statt der Ticks transfomieren:
\documentclass[12pt]{scrreprt}
\usepackage[ngerman]{babel}
\usepackage{pgfplots}% lädt auch tikz
\pgfplotsset{
  compat=1.12,
  /pgf/number format/.cd,use comma%
}
\begin{document}
\begin{figure}
\centering
\begin{tikzpicture}
%
\begin{axis}[axis x line=bottom, axis y line=left,
  xlabel= Zeit ,
  xmin=0, xmax= 330,
  ylabel= einheit,
  ymin=0, ymax=25,
  xtick={0,30,...,300},
  scaled ticks=false,
  width=0.9\textwidth, height=5cm,
  ]
\addplot[mark=, color=blue, smooth] table[x expr=\thisrowno{0}/60]{test.txt};
\end{axis}
%
\end{tikzpicture}
\caption[zeuch]{zeuch}
\label{pic:abc}
\end{figure}
\end{document}
- Dateianhänge
-
- test.txt
- (48.68 KiB) 381-mal heruntergeladen
-
- gl_plotmitvielendaten.png (15.09 KiB) 2412 mal betrachtet
Mit ein paar Änderungen im Code und einer utf8 statt utf16 kodierten Datei [tt]test.txt[/tt]
[img]http://golatex.de/files/gl_plotmitvielendaten_802.png[/img]
Code:
[code]\documentclass[12pt]{scrreprt}
\usepackage[ngerman]{babel}
\usepackage{pgfplots}% lädt auch tikz
\pgfplotsset{
compat=1.12,
/pgf/number format/.cd,use comma%
}
\begin{document}
\begin{figure}
\centering
\begin{tikzpicture}
%
\begin{axis}[axis x line=bottom, axis y line=left,
xlabel= Zeit ,
xmin=0, xmax= 20000,
ylabel= einheit,
ymin=0, ymax=25,
xtick={0,1800,3600,5400,7200,9000,10800,12600,14400,16200,18000,20800},
xticklabel={{%
\pgfkeys{/pgf/fpu}%
\pgfmathdivide{\tick}{60}%
\pgfmathprintnumber[precision=0]{\pgfmathresult}%
}},
scaled ticks=false,
width=0.9\textwidth, height=5cm,
]
\addplot[mark=, color=blue, smooth] table{test.txt};
\end{axis}
%
\end{tikzpicture}
\caption{zeuch}
\label{pic:abc}
\end{figure}
\end{document}[/code]
Alternative kann man auch die Daten statt der Ticks transfomieren:
[code]\documentclass[12pt]{scrreprt}
\usepackage[ngerman]{babel}
\usepackage{pgfplots}% lädt auch tikz
\pgfplotsset{
compat=1.12,
/pgf/number format/.cd,use comma%
}
\begin{document}
\begin{figure}
\centering
\begin{tikzpicture}
%
\begin{axis}[axis x line=bottom, axis y line=left,
xlabel= Zeit ,
xmin=0, xmax= 330,
ylabel= einheit,
ymin=0, ymax=25,
xtick={0,30,...,300},
scaled ticks=false,
width=0.9\textwidth, height=5cm,
]
\addplot[mark=, color=blue, smooth] table[x expr=\thisrowno{0}/60]{test.txt};
\end{axis}
%
\end{tikzpicture}
\caption[zeuch]{zeuch}
\label{pic:abc}
\end{figure}
\end{document}[/code]