von Bartman » Mo 4. Jul 2016, 19:03
Wie wäre es damit?
\documentclass[margin=5pt]{standalone}

\usepackage[ngerman]{babel}
\usepackage{pgfplots} % lädt tikz

\usepgfplotslibrary{units}

\pgfplotsset{
	compat=1.12,% für den Online-Editor, sonst 1.13
	/pgf/number format/.cd,
		use comma%,
%		1000 sep = {}
}

\begin{document}
\begin{tikzpicture}
\begin{axis}[
	axis x line=bottom, axis y line=left,
	xlabel=Zeit,
	ylabel=Beschriftung,
	xmin=0, xmax=540,
	ymin=59, ymax=62,
	xtick={0,60,...,540},
	xticklabel={%
		\pgfmathdivide{\tick}{60}% ähnliches Beispiel mit \pgfmathparse im Abschnitt 4.15 der pgfplots-Dokumentation
		\pgfmathprintnumber{\pgfmathresult}%
	},
	x unit=min,
	width=0.9\textwidth, height=5cm
]
\addplot[mark=none, color=blue, smooth] table{Tab1.txt};
\end{axis}
\end{tikzpicture}
\end{document}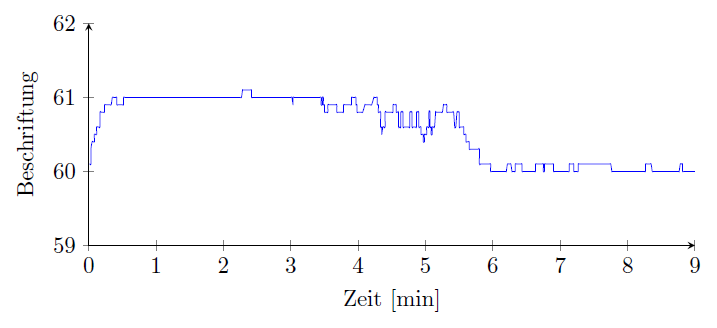
- Dateianhänge
-

- Druckfilter.png (13.8 KiB) 3167 mal betrachtet
Wie wäre es damit?
[code]\documentclass[margin=5pt]{standalone}
\usepackage[ngerman]{babel}
\usepackage{pgfplots} % lädt tikz
\usepgfplotslibrary{units}
\pgfplotsset{
compat=1.12,% für den Online-Editor, sonst 1.13
/pgf/number format/.cd,
use comma%,
% 1000 sep = {}
}
\begin{document}
\begin{tikzpicture}
\begin{axis}[
axis x line=bottom, axis y line=left,
xlabel=Zeit,
ylabel=Beschriftung,
xmin=0, xmax=540,
ymin=59, ymax=62,
xtick={0,60,...,540},
xticklabel={%
\pgfmathdivide{\tick}{60}% ähnliches Beispiel mit \pgfmathparse im Abschnitt 4.15 der pgfplots-Dokumentation
\pgfmathprintnumber{\pgfmathresult}%
},
x unit=min,
width=0.9\textwidth, height=5cm
]
\addplot[mark=none, color=blue, smooth] table{Tab1.txt};
\end{axis}
\end{tikzpicture}
\end{document}[/code]
[img]http://golatex.de/files/druckfilter_170.png[/img]