von esdd » So 5. Jun 2016, 20:48
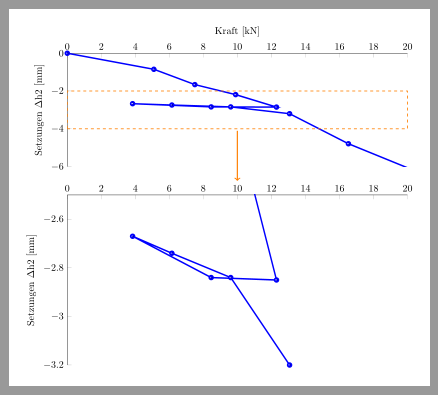
Du könntest einen groupplot verwenden, in dem unterhalb des ersten Plots ein vergrößerter Ausschnitt dargestellt wird.
\begin{filecontents*}{data.dat}
0 0
5.09 -0.85
7.50 -1.66
9.90 -2.19
12.30 -2.85
8.46 -2.84
3.84 -2.67
6.15 -2.74
9.61 -2.84
13.07 -3.20
16.53 -4.79
21.14 -6.48
%26.91 -8.26
%38.44 -14.28
%57.66 -22.34
%79.19 -32.18
%0 0.384
%0 -20
\end{filecontents*}


\documentclass[margin=5mm]{standalone}
\usepackage{pgfplots}
\pgfplotsset{compat=newest}% newest für Online-Editor, sonst derzeit 1.13
\usepackage{pgfplotstable}
\usepgfplotslibrary{groupplots}
\begin{document}
\begin{tikzpicture}
 \begin{groupplot}[
     group style = {
      group size = 1 by 2,
      xlabels at= edge top
     },
     width = 12cm,
     scale only axis,
     xmin=0,
     xmax=20,
     xlabel={Kraft [kN]},
     ylabel={Setzungen $\Delta$h2 [mm]},
     axis x line*=top, %bottom, %top,
     axis y line*=left,
     every axis plot/.append style={
      line width=1.5pt,
      mark size=2pt,
      mark=ball,
      mark options=solid,
      forget plot
     }
    ]
    \nextgroupplot[height=4cm,ymin=-6,ymax=0]
      \addplot [color= blue] table{data.dat};
      \draw[orange,dashed,thick](0,-4)rectangle(20,-2);
      \coordinate(s)at(10,-4);

    \nextgroupplot[height=6cm,ymin=-3.2,ymax=-2.5]
      \addplot [color= blue] table{data.dat};
  \end{groupplot}

  \draw[very thick, orange, ->, shorten >=2pt+\baselineskip, shorten <=2pt] (s)
  -- (group c1r2.north);
\end{tikzpicture}
\end{document}

- Dateianhänge
-
- gl_ausschnitt.png (19.7 KiB) 1357 mal betrachtet
Du könntest einen [tt]groupplot[/tt] verwenden, in dem unterhalb des ersten Plots ein vergrößerter Ausschnitt dargestellt wird.
[code]\begin{filecontents*}{data.dat}
0 0
5.09 -0.85
7.50 -1.66
9.90 -2.19
12.30 -2.85
8.46 -2.84
3.84 -2.67
6.15 -2.74
9.61 -2.84
13.07 -3.20
16.53 -4.79
21.14 -6.48
%26.91 -8.26
%38.44 -14.28
%57.66 -22.34
%79.19 -32.18
%0 0.384
%0 -20
\end{filecontents*}
\documentclass[margin=5mm]{standalone}
\usepackage{pgfplots}
\pgfplotsset{compat=newest}% newest für Online-Editor, sonst derzeit 1.13
\usepackage{pgfplotstable}
\usepgfplotslibrary{groupplots}
\begin{document}
\begin{tikzpicture}
\begin{groupplot}[
group style = {
group size = 1 by 2,
xlabels at= edge top
},
width = 12cm,
scale only axis,
xmin=0,
xmax=20,
xlabel={Kraft [kN]},
ylabel={Setzungen $\Delta$h2 [mm]},
axis x line*=top, %bottom, %top,
axis y line*=left,
every axis plot/.append style={
line width=1.5pt,
mark size=2pt,
mark=ball,
mark options=solid,
forget plot
}
]
\nextgroupplot[height=4cm,ymin=-6,ymax=0]
\addplot [color= blue] table{data.dat};
\draw[orange,dashed,thick](0,-4)rectangle(20,-2);
\coordinate(s)at(10,-4);
\nextgroupplot[height=6cm,ymin=-3.2,ymax=-2.5]
\addplot [color= blue] table{data.dat};
\end{groupplot}
\draw[very thick, orange, ->, shorten >=2pt+\baselineskip, shorten <=2pt] (s)
-- (group c1r2.north);
\end{tikzpicture}
\end{document}
[/code]
[img]http://golatex.de/files/gl_ausschnitt_630.png[/img]