von esdd » Di 5. Mai 2015, 17:30
Ich bekomme mit Deinem Code einen anderen Fehler
! Package pgfplots Error: Could not read table file 'Wertetabelle.txt'.
und aus dem gleichen Grund noch eine Warnung
Package pgfplots Warning: the current plot has no coordinates (or all have been
filtered away) on input line 37.
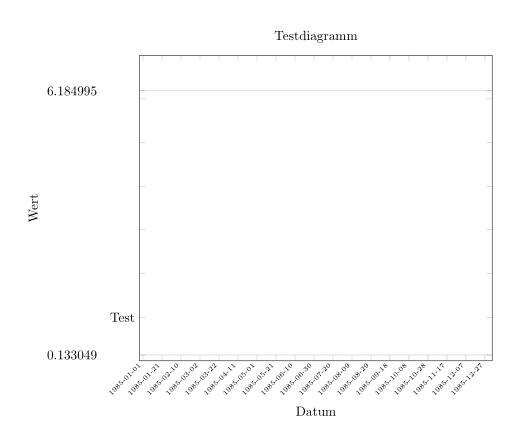
Das ist dann auch der Grund, weshalb bei mir nicht die Ticks bei 1,2,...,6 gezeichnet werden und am Tick bei 1 nicht Test steht.
Um das Koordinatensystem auch ohne Daten zu erhalten, muss ich ymin und ymax vorgeben.
\documentclass[]{report}

\usepackage[utf8]{inputenc}
\usepackage{pgfplots}

  \usepgfplotslibrary{dateplot}
  \pgfplotsset{compat=newest}

\begin{document}
    \begin{tikzpicture}
       \begin{axis}[
             % Diagrammtitel:
                  title={Testdiagramm},
             % Abmessungen:
                   width = 0.9\textwidth,
                   height = 0.5\textheight,
             % Formatierung der Abszisse:
                   xlabel = {Datum},
                   date coordinates in = x,
                   xmin = 1985-01-01,
                   xmax = 1985-12-31,
                   date ZERO = 1985-01-01,
                   try min ticks = 24,
                   enlarge x limits = 0.01,
                   x tick label style = {anchor=east, rotate=45, font=\tiny, /pgf/number format/1000 sep=},
             % Formatierung der Y-Achse:
                   ymin=0,ymax=7,
                   ylabel = {Wert},
                   ytick = {1,...,6},
                   yticklabels = {Test},
                   y tick label style = {/pgf/number format/1000 sep=},
             % Extra-Hilfslinien,
                   extra y ticks = {0.133049, 6.184995},
                   extra y tick labels={{0.133049},{6.184995}},
                   extra tick style = {grid=major, tick label style={xshift=-1cm}},
          ]
             \addplot table[x=Datum, y=Wert] {Wertetabelle.txt};
       \end{axis}
    \end{tikzpicture}
\end{document}
und erhalte das mit diesem Code erwartete Ergebnis

Allerdings vermute ich, dass Du noch ein anderes Problem hast.
Gruß
Elke
- Dateianhänge
-
- gl_yachse.png (10.96 KiB) 2351 mal betrachtet
Ich bekomme mit Deinem Code einen anderen Fehler
[quote]! Package pgfplots Error: Could not read table file 'Wertetabelle.txt'.[/quote]
und aus dem gleichen Grund noch eine Warnung
[quote]Package pgfplots Warning: the current plot has no coordinates (or all have been
filtered away) on input line 37.[/quote]
Das ist dann auch der Grund, weshalb bei mir nicht die Ticks bei 1,2,...,6 gezeichnet werden und am Tick bei 1 nicht Test steht.
Um das Koordinatensystem auch ohne Daten zu erhalten, muss ich [tt]ymin[/tt] und [tt]ymax[/tt] vorgeben.
[code]\documentclass[]{report}
\usepackage[utf8]{inputenc}
\usepackage{pgfplots}
\usepgfplotslibrary{dateplot}
\pgfplotsset{compat=newest}
\begin{document}
\begin{tikzpicture}
\begin{axis}[
% Diagrammtitel:
title={Testdiagramm},
% Abmessungen:
width = 0.9\textwidth,
height = 0.5\textheight,
% Formatierung der Abszisse:
xlabel = {Datum},
date coordinates in = x,
xmin = 1985-01-01,
xmax = 1985-12-31,
date ZERO = 1985-01-01,
try min ticks = 24,
enlarge x limits = 0.01,
x tick label style = {anchor=east, rotate=45, font=\tiny, /pgf/number format/1000 sep=},
% Formatierung der Y-Achse:
ymin=0,ymax=7,
ylabel = {Wert},
ytick = {1,...,6},
yticklabels = {Test},
y tick label style = {/pgf/number format/1000 sep=},
% Extra-Hilfslinien,
extra y ticks = {0.133049, 6.184995},
extra y tick labels={{0.133049},{6.184995}},
extra tick style = {grid=major, tick label style={xshift=-1cm}},
]
\addplot table[x=Datum, y=Wert] {Wertetabelle.txt};
\end{axis}
\end{tikzpicture}
\end{document}[/code]
und erhalte das mit diesem Code erwartete Ergebnis
[img]http://golatex.de/files/gl_yachse_191.png[/img]
Allerdings vermute ich, dass Du noch ein anderes Problem hast.
Gruß
Elke