von roadrunner_ac » Di 3. Feb 2015, 10:05
Hallo,
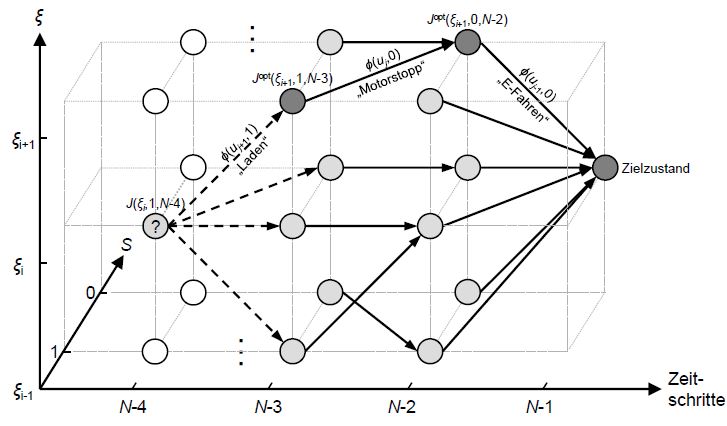
ich habe folgendes Problem. Beim Erstellen eines 3D-Gitters würde ich gerne Ticks an den Achsen haben, jedoch sollen die Werte, die dort dran stehen, frei wählbar sein. Statt y=5 will ich dort beispielsweise (N+1) stehen haben. Ich weiß leider gar nicht wie das geht und in den Anleitungen habe ich dazu nichts gefunden.
(Thema auch bei TexWelt:
http://texwelt.de/wissen/fragen/11421/3 ... derzeichen)
Dazu will ich noch ein Sonderzeichen (xi) sie z-Achse im Bild einfügen.
Mein Code bisher:
\begin{figure}[H]
\setlength\figurewidth{0.8\textwidth}
\centering
\begin{tikzpicture}[x={(0.7cm,0.7cm)},y={(1cm,0cm)}, z={(0cm,1cm)}]

%3D-Koordinatensystem:
\draw[->, >=latex] (0,0,0) -- (4,0,0) node[above]{$S$};
\draw[->, >=latex] (0,0,0) -- (0,14,0) node[below]{$y$};
\draw[->, >=latex] (0,0,0) -- (0,0,6) node[left]{$z$};

 %\draw[densely dashed]  plot[] coordinates{(2,0,0)(2,2,0)(0,2,0)(0,0,2)};
\draw [dotted] plot[] coordinates{(1,1,0)(2,1,0)(3,1,0)};
\draw [dotted] plot[] coordinates{(1,1,2.5)(2,1,2.5)(3,1,2.5)};
\draw [dotted] plot[] coordinates{(1,1,5)(2,1,5)(3,1,5)};
\draw [dotted] plot[] coordinates{(1,4.5,0)(2,4.5,0)(3,4.5,0)};
\draw [dotted] plot[] coordinates{(1,4.5,2.5)(2,4.5,2.5)(3,4.5,2.5)};
\draw [dotted] plot[] coordinates{(1,4.5,5)(2,4.5,5)(3,4.5,5)};
\draw [dotted] plot[] coordinates{(1,8,0)(2,8,0)(3,8,0)};
\draw [dotted] plot[] coordinates{(1,8,2.5)(2,8,2.5)(3,8,2.5)};
\draw [dotted] plot[] coordinates{(1,8,5)(2,8,5)(3,8,5)};
\draw [dotted] plot[] coordinates{(1,1,0)(1,1,2.5)(1,1,5)};
\draw [dotted] plot[] coordinates{(2,1,0)(2,1,2.5)(2,1,5)};
\draw [dotted] plot[] coordinates{(3,1,0)(3,1,2.5)(3,1,5)};
\draw [dotted] plot[] coordinates{(1,4.5,0)(1,4.5,2.5)(1,4.5,5)};
\draw [dotted] plot[] coordinates{(2,4.5,0)(2,4.5,2.5)(2,4.5,5)};
\draw [dotted] plot[] coordinates{(3,4.5,0)(3,4.5,2.5)(3,4.5,5)};
\draw [dotted] plot[] coordinates{(1,8,0)(1,8,2.5)(1,8,5)};
\draw [dotted] plot[] coordinates{(2,8,0)(2,8,2.5)(2,8,5)};
\draw [dotted] plot[] coordinates{(3,8,0)(3,8,2.5)(3,8,5)};
\draw [dotted] plot[] coordinates{(1,11.5,0)(1,11.5,2.5)(1,11.5,5)};%high
\draw [dotted] plot[] coordinates{(2,11.5,0)(2,11.5,2.5)(2,11.5,5)};
\draw [dotted] plot[] coordinates{(3,11.5,0)(3,11.5,2.5)(3,11.5,5)};
\draw [dotted] plot[] coordinates{(1,0,0)(1,11.5,0)}; % horizontal
\draw [dotted] plot[] coordinates{(2,0,0)(2,11.5,0)};
\draw [dotted] plot[] coordinates{(3,0,0)(3,11.5,0)};
\draw [dotted] plot[] coordinates{(1,0,2.5)(1,11.5,2.5)};
\draw [dotted] plot[] coordinates{(2,0,2.5)(2,11.5,2.5)};
\draw [dotted] plot[] coordinates{(3,0,2.5)(3,11.5,2.5)};
\draw [dotted] plot[] coordinates{(1,0,5)(1,11.5,5)};
\draw [dotted] plot[] coordinates{(2,0,5)(2,11.5,5)};
\draw [dotted] plot[] coordinates{(3,0,5)(3,11.5,5)};
%\draw [dotted] plot[] coordinates{(1,0,0)(3,0,0)};
\draw [dotted] plot[] coordinates{(1,0,2.5)(3,0,2.5)};
\draw [dotted] plot[] coordinates{(1,0,5)(3,0,5)};
\draw [dotted] plot[] coordinates{(1,0,0)(1,0,5)};
\draw [dotted] plot[] coordinates{(2,0,0)(2,0,5)};
\draw [dotted] plot[] coordinates{(3,0,0)(3,0,5)};
\draw [dotted] plot[] coordinates{(1,11.5,0)(3,11.5,0)};
\draw [dotted] plot[] coordinates{(1,11.5,2.5)(3,11.5,2.5)};
\draw [dotted] plot[] coordinates{(1,11.5,5)(3,11.5,5)};
 %(1,1,0)(1,1,2.5)(1,1,5)
\shadedraw  plot [only marks, mark=*, mark size=4.5pt, mark options={fill=gray}] coordinates{
(1,1,0)(2,1,0)(3,1,0) %y1
(1,1,2.5)(2,1,2.5)(3,1,2.5)
(1,1,5)(2,1,5)(3,1,5)
(1,4.5,0)(2,4.5,0)(3,4.5,0) % y2
(1,4.5,2.5)(2,4.5,2.5)(3,4.5,2.5)
(1,4.5,5)(2,4.5,5)(3,4.5,5)
(1,8,0)(2,8,0)(3,8,0) % y3
(1,8,2.5)(2,8,2.5)(3,8,2.5)
(1,8,5)(2,8,5)(3,8,5)
(2,11.5,2.5)
};
 \end{tikzpicture}
\caption{3D-DDP}
\label{img:3D-DDP}
\end{figure}
- Dateianhänge
-
- problem.JPG (50.74 KiB) 2812 mal betrachtet
Hallo,
ich habe folgendes Problem. Beim Erstellen eines 3D-Gitters würde ich gerne Ticks an den Achsen haben, jedoch sollen die Werte, die dort dran stehen, frei wählbar sein. Statt y=5 will ich dort beispielsweise (N+1) stehen haben. Ich weiß leider gar nicht wie das geht und in den Anleitungen habe ich dazu nichts gefunden.
(Thema auch bei TexWelt: http://texwelt.de/wissen/fragen/11421/3d-plot-achsen-ticks-manuell-beschriften-und-sonderzeichen)
Dazu will ich noch ein Sonderzeichen (xi) sie z-Achse im Bild einfügen.
Mein Code bisher:
[code]\begin{figure}[H]
\setlength\figurewidth{0.8\textwidth}
\centering
\begin{tikzpicture}[x={(0.7cm,0.7cm)},y={(1cm,0cm)}, z={(0cm,1cm)}]
%3D-Koordinatensystem:
\draw[->, >=latex] (0,0,0) -- (4,0,0) node[above]{$S$};
\draw[->, >=latex] (0,0,0) -- (0,14,0) node[below]{$y$};
\draw[->, >=latex] (0,0,0) -- (0,0,6) node[left]{$z$};
%\draw[densely dashed] plot[] coordinates{(2,0,0)(2,2,0)(0,2,0)(0,0,2)};
\draw [dotted] plot[] coordinates{(1,1,0)(2,1,0)(3,1,0)};
\draw [dotted] plot[] coordinates{(1,1,2.5)(2,1,2.5)(3,1,2.5)};
\draw [dotted] plot[] coordinates{(1,1,5)(2,1,5)(3,1,5)};
\draw [dotted] plot[] coordinates{(1,4.5,0)(2,4.5,0)(3,4.5,0)};
\draw [dotted] plot[] coordinates{(1,4.5,2.5)(2,4.5,2.5)(3,4.5,2.5)};
\draw [dotted] plot[] coordinates{(1,4.5,5)(2,4.5,5)(3,4.5,5)};
\draw [dotted] plot[] coordinates{(1,8,0)(2,8,0)(3,8,0)};
\draw [dotted] plot[] coordinates{(1,8,2.5)(2,8,2.5)(3,8,2.5)};
\draw [dotted] plot[] coordinates{(1,8,5)(2,8,5)(3,8,5)};
\draw [dotted] plot[] coordinates{(1,1,0)(1,1,2.5)(1,1,5)};
\draw [dotted] plot[] coordinates{(2,1,0)(2,1,2.5)(2,1,5)};
\draw [dotted] plot[] coordinates{(3,1,0)(3,1,2.5)(3,1,5)};
\draw [dotted] plot[] coordinates{(1,4.5,0)(1,4.5,2.5)(1,4.5,5)};
\draw [dotted] plot[] coordinates{(2,4.5,0)(2,4.5,2.5)(2,4.5,5)};
\draw [dotted] plot[] coordinates{(3,4.5,0)(3,4.5,2.5)(3,4.5,5)};
\draw [dotted] plot[] coordinates{(1,8,0)(1,8,2.5)(1,8,5)};
\draw [dotted] plot[] coordinates{(2,8,0)(2,8,2.5)(2,8,5)};
\draw [dotted] plot[] coordinates{(3,8,0)(3,8,2.5)(3,8,5)};
\draw [dotted] plot[] coordinates{(1,11.5,0)(1,11.5,2.5)(1,11.5,5)};%high
\draw [dotted] plot[] coordinates{(2,11.5,0)(2,11.5,2.5)(2,11.5,5)};
\draw [dotted] plot[] coordinates{(3,11.5,0)(3,11.5,2.5)(3,11.5,5)};
\draw [dotted] plot[] coordinates{(1,0,0)(1,11.5,0)}; % horizontal
\draw [dotted] plot[] coordinates{(2,0,0)(2,11.5,0)};
\draw [dotted] plot[] coordinates{(3,0,0)(3,11.5,0)};
\draw [dotted] plot[] coordinates{(1,0,2.5)(1,11.5,2.5)};
\draw [dotted] plot[] coordinates{(2,0,2.5)(2,11.5,2.5)};
\draw [dotted] plot[] coordinates{(3,0,2.5)(3,11.5,2.5)};
\draw [dotted] plot[] coordinates{(1,0,5)(1,11.5,5)};
\draw [dotted] plot[] coordinates{(2,0,5)(2,11.5,5)};
\draw [dotted] plot[] coordinates{(3,0,5)(3,11.5,5)};
%\draw [dotted] plot[] coordinates{(1,0,0)(3,0,0)};
\draw [dotted] plot[] coordinates{(1,0,2.5)(3,0,2.5)};
\draw [dotted] plot[] coordinates{(1,0,5)(3,0,5)};
\draw [dotted] plot[] coordinates{(1,0,0)(1,0,5)};
\draw [dotted] plot[] coordinates{(2,0,0)(2,0,5)};
\draw [dotted] plot[] coordinates{(3,0,0)(3,0,5)};
\draw [dotted] plot[] coordinates{(1,11.5,0)(3,11.5,0)};
\draw [dotted] plot[] coordinates{(1,11.5,2.5)(3,11.5,2.5)};
\draw [dotted] plot[] coordinates{(1,11.5,5)(3,11.5,5)};
%(1,1,0)(1,1,2.5)(1,1,5)
\shadedraw plot [only marks, mark=*, mark size=4.5pt, mark options={fill=gray}] coordinates{
(1,1,0)(2,1,0)(3,1,0) %y1
(1,1,2.5)(2,1,2.5)(3,1,2.5)
(1,1,5)(2,1,5)(3,1,5)
(1,4.5,0)(2,4.5,0)(3,4.5,0) % y2
(1,4.5,2.5)(2,4.5,2.5)(3,4.5,2.5)
(1,4.5,5)(2,4.5,5)(3,4.5,5)
(1,8,0)(2,8,0)(3,8,0) % y3
(1,8,2.5)(2,8,2.5)(3,8,2.5)
(1,8,5)(2,8,5)(3,8,5)
(2,11.5,2.5)
};
\end{tikzpicture}
\caption{3D-DDP}
\label{img:3D-DDP}
\end{figure}[/code]