von esdd » Do 25. Jun 2015, 22:17
Dein Problem hat meiner Meinung nach nichts mit dem anderen zu tun. Mach doch bitte das nächste Mal einfach ein neues Thema auf.
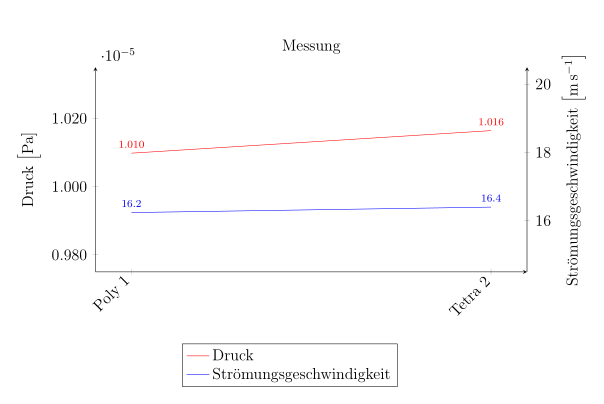
Du musst nach dem ersten \addplot...; noch ein Label wie \label{pgfplots:plot1} setzen. Dann kannst Du das in \addlegendimage als Referenz verwenden:
\documentclass[a4paper,12pt,headsepline]{scrartcl}
\usepackage[utf8]{inputenc}
\usepackage[ngerman]{babel}
\usepackage{pgfplots}
\pgfplotsset{width=7cm,compat=1.12}
\usepackage{siunitx}

\begin{document}
\begin{tikzpicture}
\begin{axis}[
title=Messung,
width=13cm,
height=7cm,
ymin=15,
ymax=20,
axis y line=right,
axis x line=bottom,
enlargelimits=0.1,
ylabel={Strömungsgeschwindigkeit \Big[$\SI{}{\metre\per\second} $\Big]},
symbolic x coords={Poly 1,Poly 2,Poly 3,
Poly 4, Auto 1, Auto 2, Auto 3, Auto 4, Trimmer 1, Trimmer 2, Tetra 1, Tetra 2},
xtick=data,
nodes near coords,
every node near coord/.append style={
font=\scriptsize,
/pgf/number format/.cd,
fixed zerofill,
precision=1},
x tick label style={rotate=45,anchor=east}
]
\addplot [color=blue,
line legend,
sharp plot,
]
coordinates{(Poly 1, 16.24)
(Tetra 2, 16.40 )};
\label{pgfplots:plot1}% <- hier muss ein Label gesetzt werden
\end{axis}

\begin{axis}[
width=13cm,
height=7cm,
ymin=0.980e+05,
ymax=1.030e+05,
axis y line=left,
axis x line=none,
scaled y ticks=manual:
{$\cdot10^{-5}$}{%
\pgfmathparse{#1/100000}%
},
yticklabel style={
/pgf/number format/fixed zerofill,
/pgf/number format/precision=3},
enlargelimits=0.1,
ylabel={Druck \Big[$\SI{}{\pascal}$\big]},
legend pos=north east,
legend cell align=left,
legend style={at={(0.7,-0.35)}},
label style=sloped,
symbolic x coords={Poly 1,Poly 2,Poly 3,
Poly 4, Auto 1, Auto 2, Auto 3, Auto 4, Trimmer 1, Trimmer 2, Tetra 1, Tetra 2},
xtick=data,
nodes near coords,
every node near coord/.append style={
font=\scriptsize,
/pgf/number format/.cd,
fixed zerofill,
precision=3},
point meta=y*10^-5,
x tick label style={rotate=45,anchor=east},
]
\addplot [color=red,
line legend,
sharp plot,
]
coordinates{(Poly 1, 1.0098e+05)
(Tetra 2, 1.0164e+05)};

\addlegendimage{/pgfplots/refstyle={pgfplots:plot1}}% <- und hier muss das Label benutzt werden
\addlegendentry{Druck}
\addlegendentry{Strömungsgeschwindigkeit}
\end{axis}
\end{tikzpicture}
\end{document}
Gruß
Elke
- Dateianhänge
-

- gl_addlegendimage.png (20.84 KiB) 6480 mal betrachtet
Dein Problem hat meiner Meinung nach nichts mit dem anderen zu tun. Mach doch bitte das nächste Mal einfach ein neues Thema auf.
Du musst nach dem ersten [tt]\addplot...;[/tt] noch ein Label wie [tt]\label{pgfplots:plot1}[/tt] setzen. Dann kannst Du das in [tt]\addlegendimage[/tt] als Referenz verwenden:
[code]\documentclass[a4paper,12pt,headsepline]{scrartcl}
\usepackage[utf8]{inputenc}
\usepackage[ngerman]{babel}
\usepackage{pgfplots}
\pgfplotsset{width=7cm,compat=1.12}
\usepackage{siunitx}
\begin{document}
\begin{tikzpicture}
\begin{axis}[
title=Messung,
width=13cm,
height=7cm,
ymin=15,
ymax=20,
axis y line=right,
axis x line=bottom,
enlargelimits=0.1,
ylabel={Strömungsgeschwindigkeit \Big[$\SI{}{\metre\per\second} $\Big]},
symbolic x coords={Poly 1,Poly 2,Poly 3,
Poly 4, Auto 1, Auto 2, Auto 3, Auto 4, Trimmer 1, Trimmer 2, Tetra 1, Tetra 2},
xtick=data,
nodes near coords,
every node near coord/.append style={
font=\scriptsize,
/pgf/number format/.cd,
fixed zerofill,
precision=1},
x tick label style={rotate=45,anchor=east}
]
\addplot [color=blue,
line legend,
sharp plot,
]
coordinates{(Poly 1, 16.24)
(Tetra 2, 16.40 )};
\label{pgfplots:plot1}% <- hier muss ein Label gesetzt werden
\end{axis}
\begin{axis}[
width=13cm,
height=7cm,
ymin=0.980e+05,
ymax=1.030e+05,
axis y line=left,
axis x line=none,
scaled y ticks=manual:
{$\cdot10^{-5}$}{%
\pgfmathparse{#1/100000}%
},
yticklabel style={
/pgf/number format/fixed zerofill,
/pgf/number format/precision=3},
enlargelimits=0.1,
ylabel={Druck \Big[$\SI{}{\pascal}$\big]},
legend pos=north east,
legend cell align=left,
legend style={at={(0.7,-0.35)}},
label style=sloped,
symbolic x coords={Poly 1,Poly 2,Poly 3,
Poly 4, Auto 1, Auto 2, Auto 3, Auto 4, Trimmer 1, Trimmer 2, Tetra 1, Tetra 2},
xtick=data,
nodes near coords,
every node near coord/.append style={
font=\scriptsize,
/pgf/number format/.cd,
fixed zerofill,
precision=3},
point meta=y*10^-5,
x tick label style={rotate=45,anchor=east},
]
\addplot [color=red,
line legend,
sharp plot,
]
coordinates{(Poly 1, 1.0098e+05)
(Tetra 2, 1.0164e+05)};
\addlegendimage{/pgfplots/refstyle={pgfplots:plot1}}% <- und hier muss das Label benutzt werden
\addlegendentry{Druck}
\addlegendentry{Strömungsgeschwindigkeit}
\end{axis}
\end{tikzpicture}
\end{document}[/code]
Gruß
Elke
[img]http://golatex.de/files/gl_addlegendimage_366.png[/img]