von Eómer » Do 6. Apr 2023, 15:36
Hallo,
ich möchte eine .jpg Abbildung und einen mit Tikz erstellten Graphen nebeneinander abbilden. Dafür arbeite ich mit subcaptionblocks in der figure Umgebung. Allerdings bildet LaTex - egal wie klein ich die Bildgröße angebe (ich habe bei .49 angefangen und bin mittlerwile bei .3) - die beiden untereinander statt nebeneinander ab.
Mache ich da irgendetwas grundlegend falsch? Gibt es einen anderen Weg die beiden nebeneinander abzubilden oder muss ich mich mit untereinander abfinden? Oder liegt es an den Abbildungen?
Vielen Dank und viele Grüße
Eómer
\usepackage{tikz}
\usepackage{graphicx}
\usepackage{subcaption}

\begin{document}

\begin{figure}[H]
\centering

\begin{subcaptionblock}{0.3\textwidth}
\centering
\includegraphics{NachbarstaatsfärbungKlein}
\end{subcaptionblock}%


\begin{subcaptionblock}{0.3\textwidth}
\centering
\begin{tikzpicture}[x=0.75pt,y=0.75pt,yscale=-1,xscale=1]
%uncomment if require: \path (0,364); %set diagram left start at 0, and has height of 364

%Shape: Circle [id:dp6583366308075038]
\draw   (110,120) .. controls (110,114.48) and (114.48,110) .. (120,110) .. controls (125.52,110) and (130,114.48) .. (130,120) .. controls (130,125.52) and (125.52,130) .. (120,130) .. controls (114.48,130) and (110,125.52) .. (110,120) -- cycle ;
%Shape: Circle [id:dp09572665264802371]
\draw   (190.9,61.22) .. controls (190.9,55.7) and (195.38,51.22) .. (200.9,51.22) .. controls (206.42,51.22) and (210.9,55.7) .. (210.9,61.22) .. controls (210.9,66.74) and (206.42,71.22) .. (200.9,71.22) .. controls (195.38,71.22) and (190.9,66.74) .. (190.9,61.22) -- cycle ;
%Shape: Circle [id:dp2226361386289477]
\draw   (210,120) .. controls (210,114.48) and (214.48,110) .. (220,110) .. controls (225.52,110) and (230,114.48) .. (230,120) .. controls (230,125.52) and (225.52,130) .. (220,130) .. controls (214.48,130) and (210,125.52) .. (210,120) -- cycle ;
%Shape: Circle [id:dp579844635467393]
\draw   (190.9,178.78) .. controls (190.9,173.26) and (195.38,168.78) .. (200.9,168.78) .. controls (206.42,168.78) and (210.9,173.26) .. (210.9,178.78) .. controls (210.9,184.3) and (206.42,188.78) .. (200.9,188.78) .. controls (195.38,188.78) and (190.9,184.3) .. (190.9,178.78) -- cycle ;
%Shape: Circle [id:dp42262029577407056]
\draw   (140.9,215.11) .. controls (140.9,209.58) and (145.38,205.11) .. (150.9,205.11) .. controls (156.42,205.11) and (160.9,209.58) .. (160.9,215.11) .. controls (160.9,220.63) and (156.42,225.11) .. (150.9,225.11) .. controls (145.38,225.11) and (140.9,220.63) .. (140.9,215.11) -- cycle ;
%Shape: Circle [id:dp1230136036173235]
\draw   (79.1,215.11) .. controls (79.1,209.58) and (83.58,205.11) .. (89.1,205.11) .. controls (94.62,205.11) and (99.1,209.58) .. (99.1,215.11) .. controls (99.1,220.63) and (94.62,225.11) .. (89.1,225.11) .. controls (83.58,225.11) and (79.1,220.63) .. (79.1,215.11) -- cycle ;
%Shape: Circle [id:dp3697972196229963]
\draw   (65,150) .. controls (65,144.48) and (69.48,140) .. (75,140) .. controls (80.52,140) and (85,144.48) .. (85,150) .. controls (85,155.52) and (80.52,160) .. (75,160) .. controls (69.48,160) and (65,155.52) .. (65,150) -- cycle ;
%Shape: Circle [id:dp08837041216160291]
\draw   (10,120) .. controls (10,114.48) and (14.48,110) .. (20,110) .. controls (25.52,110) and (30,114.48) .. (30,120) .. controls (30,125.52) and (25.52,130) .. (20,130) .. controls (14.48,130) and (10,125.52) .. (10,120) -- cycle ;
%Shape: Circle [id:dp8486772092331354]
\draw   (29.1,61.22) .. controls (29.1,55.7) and (33.58,51.22) .. (39.1,51.22) .. controls (44.62,51.22) and (49.1,55.7) .. (49.1,61.22) .. controls (49.1,66.74) and (44.62,71.22) .. (39.1,71.22) .. controls (33.58,71.22) and (29.1,66.74) .. (29.1,61.22) -- cycle ;
%Shape: Circle [id:dp8461197759877916]
\draw   (110,24.89) .. controls (110,19.37) and (114.48,14.89) .. (120,14.89) .. controls (125.52,14.89) and (130,19.37) .. (130,24.89) .. controls (130,30.42) and (125.52,34.89) .. (120,34.89) .. controls (114.48,34.89) and (110,30.42) .. (110,24.89) -- cycle ;
%Straight Lines [id:da40213548791858456]
\draw    (204.08,70.56) -- (217.12,110.16) ;
%Straight Lines [id:da5640847994242255]
\draw    (216.88,129.56) -- (204.32,169.44) ;
%Straight Lines [id:da9687796973762693]
\draw    (192.88,184.88) -- (158.72,209.28) ;
%Straight Lines [id:da3833192216208551]
\draw    (99.1,215.11) -- (140.9,215.11) ;
%Straight Lines [id:da5209266140918093]
\draw    (75,160) -- (85.8,205.75) ;
%Straight Lines [id:da235251289199212]
\draw    (82.73,143.57) -- (111.92,125.76) ;
%Straight Lines [id:da8033081391295495]
\draw    (120,34.89) -- (120,110) ;
%Straight Lines [id:da9877255557218055]
\draw    (130,120) -- (210,120) ;
%Straight Lines [id:da5577905788135293]
\draw    (30,120) -- (110,120) ;
%Straight Lines [id:da8515744488781313]
\draw    (48,66.64) -- (112,113.2) ;
%Straight Lines [id:da3026716142402064]
\draw    (127.6,112. -- (192.8,66) ;
%Straight Lines [id:da1980522312423133]
\draw    (128.4,126.04) -- (192.8,172.4) ;
%Straight Lines [id:da14598006203180458]
\draw    (124,129.65) -- (147.6,205.68) ;
%Straight Lines [id:da9839827092202094]
\draw    (116.4,128.92) -- (93.2,205.68) ;
%Straight Lines [id:da9870372852566948]
\draw    (36,70.6) -- (23.3,111.25) ;
%Straight Lines [id:da2967140202384312]
\draw    (28,125.1) -- (65.73,145.57) ;
%Straight Lines [id:da3693439925969816]
\draw    (23,129.1) -- (81.3,209.75) ;

% Text Node
\draw (127,32) node [anchor=north west][inner sep=0.75pt]  [font=\footnotesize] [align=left] {DK};
% Text Node
\draw (108,98) node [anchor=north west][inner sep=0.75pt]  [font=\footnotesize] [align=left] {D};
% Text Node
\draw (209,68) node [anchor=north west][inner sep=0.75pt]  [font=\footnotesize] [align=left] {PL};
% Text Node
\draw (224.67,128.67) node [anchor=north west][inner sep=0.75pt]  [font=\footnotesize] [align=left] {CZ};
% Text Node
\draw (208,184) node [anchor=north west][inner sep=0.75pt]  [font=\footnotesize] [align=left] {A};
% Text Node
\draw (158.67,220) node [anchor=north west][inner sep=0.75pt]  [font=\footnotesize] [align=left] {CH};
% Text Node
\draw (69,219) node [anchor=north west][inner sep=0.75pt]  [font=\footnotesize] [align=left] {F};
% Text Node
\draw (82.33,155) node [anchor=north west][inner sep=0.75pt]  [font=\footnotesize] [align=left] {L};
% Text Node
\draw (4,128) node [anchor=north west][inner sep=0.75pt]  [font=\footnotesize] [align=left] {B};
% Text Node
\draw (13,67) node [anchor=north west][inner sep=0.75pt]  [font=\footnotesize] [align=left] {NL};

\end{tikzpicture}
\end{subcaptionblock}

\caption{Die Abstraktion der politischen Karte Deutschlands und dessen Nachbarländer zu einem Graphen}
\end{figure}

\end{document}
-- (192.8,66) ;
%Straight Lines [id:da1980522312423133]
\draw (128.4,126.04) -- (192.8,172.4) ;
%Straight Lines [id:da14598006203180458]
\draw (124,129.65) -- (147.6,205.68) ;
%Straight Lines [id:da9839827092202094]
\draw (116.4,128.92) -- (93.2,205.68) ;
%Straight Lines [id:da9870372852566948]
\draw (36,70.6) -- (23.3,111.25) ;
%Straight Lines [id:da2967140202384312]
\draw (28,125.1) -- (65.73,145.57) ;
%Straight Lines [id:da3693439925969816]
\draw (23,129.1) -- (81.3,209.75) ;
% Text Node
\draw (127,32) node [anchor=north west][inner sep=0.75pt] [font=\footnotesize] [align=left] {DK};
% Text Node
\draw (108,98) node [anchor=north west][inner sep=0.75pt] [font=\footnotesize] [align=left] {D};
% Text Node
\draw (209,68) node [anchor=north west][inner sep=0.75pt] [font=\footnotesize] [align=left] {PL};
% Text Node
\draw (224.67,128.67) node [anchor=north west][inner sep=0.75pt] [font=\footnotesize] [align=left] {CZ};
% Text Node
\draw (208,184) node [anchor=north west][inner sep=0.75pt] [font=\footnotesize] [align=left] {A};
% Text Node
\draw (158.67,220) node [anchor=north west][inner sep=0.75pt] [font=\footnotesize] [align=left] {CH};
% Text Node
\draw (69,219) node [anchor=north west][inner sep=0.75pt] [font=\footnotesize] [align=left] {F};
% Text Node
\draw (82.33,155) node [anchor=north west][inner sep=0.75pt] [font=\footnotesize] [align=left] {L};
% Text Node
\draw (4,128) node [anchor=north west][inner sep=0.75pt] [font=\footnotesize] [align=left] {B};
% Text Node
\draw (13,67) node [anchor=north west][inner sep=0.75pt] [font=\footnotesize] [align=left] {NL};
\end{tikzpicture}
\end{subcaptionblock}
\caption{Die Abstraktion der politischen Karte Deutschlands und dessen Nachbarländer zu einem Graphen}
\end{figure}
\end{document}
- Dateianhänge
-
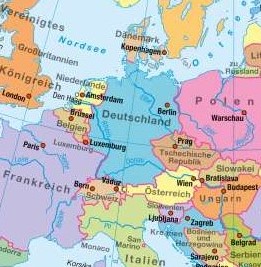
- Das ist die Abbildung
- NachbarstaatsfärbungKlein.jpg (67.75 KiB) 6608 mal betrachtet
Hallo,
ich möchte eine .jpg Abbildung und einen mit Tikz erstellten Graphen nebeneinander abbilden. Dafür arbeite ich mit subcaptionblocks in der figure Umgebung. Allerdings bildet LaTex - egal wie klein ich die Bildgröße angebe (ich habe bei .49 angefangen und bin mittlerwile bei .3) - die beiden untereinander statt nebeneinander ab.
Mache ich da irgendetwas grundlegend falsch? Gibt es einen anderen Weg die beiden nebeneinander abzubilden oder muss ich mich mit untereinander abfinden? Oder liegt es an den Abbildungen?
Vielen Dank und viele Grüße
Eómer
[code]
\usepackage{tikz}
\usepackage{graphicx}
\usepackage{subcaption}
\begin{document}
\begin{figure}[H]
\centering
\begin{subcaptionblock}{0.3\textwidth}
\centering
\includegraphics{NachbarstaatsfärbungKlein}
\end{subcaptionblock}%
\begin{subcaptionblock}{0.3\textwidth}
\centering
\begin{tikzpicture}[x=0.75pt,y=0.75pt,yscale=-1,xscale=1]
%uncomment if require: \path (0,364); %set diagram left start at 0, and has height of 364
%Shape: Circle [id:dp6583366308075038]
\draw (110,120) .. controls (110,114.48) and (114.48,110) .. (120,110) .. controls (125.52,110) and (130,114.48) .. (130,120) .. controls (130,125.52) and (125.52,130) .. (120,130) .. controls (114.48,130) and (110,125.52) .. (110,120) -- cycle ;
%Shape: Circle [id:dp09572665264802371]
\draw (190.9,61.22) .. controls (190.9,55.7) and (195.38,51.22) .. (200.9,51.22) .. controls (206.42,51.22) and (210.9,55.7) .. (210.9,61.22) .. controls (210.9,66.74) and (206.42,71.22) .. (200.9,71.22) .. controls (195.38,71.22) and (190.9,66.74) .. (190.9,61.22) -- cycle ;
%Shape: Circle [id:dp2226361386289477]
\draw (210,120) .. controls (210,114.48) and (214.48,110) .. (220,110) .. controls (225.52,110) and (230,114.48) .. (230,120) .. controls (230,125.52) and (225.52,130) .. (220,130) .. controls (214.48,130) and (210,125.52) .. (210,120) -- cycle ;
%Shape: Circle [id:dp579844635467393]
\draw (190.9,178.78) .. controls (190.9,173.26) and (195.38,168.78) .. (200.9,168.78) .. controls (206.42,168.78) and (210.9,173.26) .. (210.9,178.78) .. controls (210.9,184.3) and (206.42,188.78) .. (200.9,188.78) .. controls (195.38,188.78) and (190.9,184.3) .. (190.9,178.78) -- cycle ;
%Shape: Circle [id:dp42262029577407056]
\draw (140.9,215.11) .. controls (140.9,209.58) and (145.38,205.11) .. (150.9,205.11) .. controls (156.42,205.11) and (160.9,209.58) .. (160.9,215.11) .. controls (160.9,220.63) and (156.42,225.11) .. (150.9,225.11) .. controls (145.38,225.11) and (140.9,220.63) .. (140.9,215.11) -- cycle ;
%Shape: Circle [id:dp1230136036173235]
\draw (79.1,215.11) .. controls (79.1,209.58) and (83.58,205.11) .. (89.1,205.11) .. controls (94.62,205.11) and (99.1,209.58) .. (99.1,215.11) .. controls (99.1,220.63) and (94.62,225.11) .. (89.1,225.11) .. controls (83.58,225.11) and (79.1,220.63) .. (79.1,215.11) -- cycle ;
%Shape: Circle [id:dp3697972196229963]
\draw (65,150) .. controls (65,144.48) and (69.48,140) .. (75,140) .. controls (80.52,140) and (85,144.48) .. (85,150) .. controls (85,155.52) and (80.52,160) .. (75,160) .. controls (69.48,160) and (65,155.52) .. (65,150) -- cycle ;
%Shape: Circle [id:dp08837041216160291]
\draw (10,120) .. controls (10,114.48) and (14.48,110) .. (20,110) .. controls (25.52,110) and (30,114.48) .. (30,120) .. controls (30,125.52) and (25.52,130) .. (20,130) .. controls (14.48,130) and (10,125.52) .. (10,120) -- cycle ;
%Shape: Circle [id:dp8486772092331354]
\draw (29.1,61.22) .. controls (29.1,55.7) and (33.58,51.22) .. (39.1,51.22) .. controls (44.62,51.22) and (49.1,55.7) .. (49.1,61.22) .. controls (49.1,66.74) and (44.62,71.22) .. (39.1,71.22) .. controls (33.58,71.22) and (29.1,66.74) .. (29.1,61.22) -- cycle ;
%Shape: Circle [id:dp8461197759877916]
\draw (110,24.89) .. controls (110,19.37) and (114.48,14.89) .. (120,14.89) .. controls (125.52,14.89) and (130,19.37) .. (130,24.89) .. controls (130,30.42) and (125.52,34.89) .. (120,34.89) .. controls (114.48,34.89) and (110,30.42) .. (110,24.89) -- cycle ;
%Straight Lines [id:da40213548791858456]
\draw (204.08,70.56) -- (217.12,110.16) ;
%Straight Lines [id:da5640847994242255]
\draw (216.88,129.56) -- (204.32,169.44) ;
%Straight Lines [id:da9687796973762693]
\draw (192.88,184.88) -- (158.72,209.28) ;
%Straight Lines [id:da3833192216208551]
\draw (99.1,215.11) -- (140.9,215.11) ;
%Straight Lines [id:da5209266140918093]
\draw (75,160) -- (85.8,205.75) ;
%Straight Lines [id:da235251289199212]
\draw (82.73,143.57) -- (111.92,125.76) ;
%Straight Lines [id:da8033081391295495]
\draw (120,34.89) -- (120,110) ;
%Straight Lines [id:da9877255557218055]
\draw (130,120) -- (210,120) ;
%Straight Lines [id:da5577905788135293]
\draw (30,120) -- (110,120) ;
%Straight Lines [id:da8515744488781313]
\draw (48,66.64) -- (112,113.2) ;
%Straight Lines [id:da3026716142402064]
\draw (127.6,112.8) -- (192.8,66) ;
%Straight Lines [id:da1980522312423133]
\draw (128.4,126.04) -- (192.8,172.4) ;
%Straight Lines [id:da14598006203180458]
\draw (124,129.65) -- (147.6,205.68) ;
%Straight Lines [id:da9839827092202094]
\draw (116.4,128.92) -- (93.2,205.68) ;
%Straight Lines [id:da9870372852566948]
\draw (36,70.6) -- (23.3,111.25) ;
%Straight Lines [id:da2967140202384312]
\draw (28,125.1) -- (65.73,145.57) ;
%Straight Lines [id:da3693439925969816]
\draw (23,129.1) -- (81.3,209.75) ;
% Text Node
\draw (127,32) node [anchor=north west][inner sep=0.75pt] [font=\footnotesize] [align=left] {DK};
% Text Node
\draw (108,98) node [anchor=north west][inner sep=0.75pt] [font=\footnotesize] [align=left] {D};
% Text Node
\draw (209,68) node [anchor=north west][inner sep=0.75pt] [font=\footnotesize] [align=left] {PL};
% Text Node
\draw (224.67,128.67) node [anchor=north west][inner sep=0.75pt] [font=\footnotesize] [align=left] {CZ};
% Text Node
\draw (208,184) node [anchor=north west][inner sep=0.75pt] [font=\footnotesize] [align=left] {A};
% Text Node
\draw (158.67,220) node [anchor=north west][inner sep=0.75pt] [font=\footnotesize] [align=left] {CH};
% Text Node
\draw (69,219) node [anchor=north west][inner sep=0.75pt] [font=\footnotesize] [align=left] {F};
% Text Node
\draw (82.33,155) node [anchor=north west][inner sep=0.75pt] [font=\footnotesize] [align=left] {L};
% Text Node
\draw (4,128) node [anchor=north west][inner sep=0.75pt] [font=\footnotesize] [align=left] {B};
% Text Node
\draw (13,67) node [anchor=north west][inner sep=0.75pt] [font=\footnotesize] [align=left] {NL};
\end{tikzpicture}
\end{subcaptionblock}
\caption{Die Abstraktion der politischen Karte Deutschlands und dessen Nachbarländer zu einem Graphen}
\end{figure}
\end{document}
[/code]