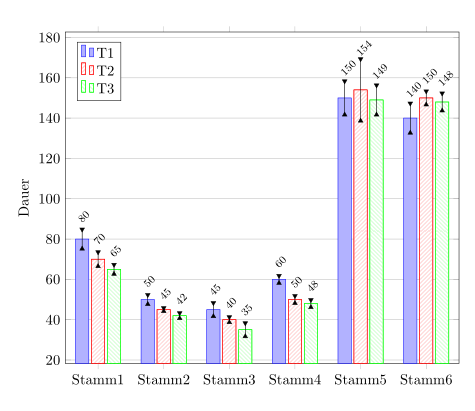
ich versuche gerade von Excel-Diagrammen auf pgfplots in Latex umzusteigen. Ich habe nun folgendes Problem: Ich habe ein Balkendiagramm mit jeweils 3 zusammengefassten Balken, diese haben jeweils eine Standardabweichung, die abgebildet werden soll. Außerdem soll der y-Wert bei jedem Balken angegeben werden. Wenn ich diesen mit
nodes near coords
nodes near coords align={...},
every node near coord/.append style={...}Es wäre toll, wenn mir jemand helfen könnte,
- die Werte um 45° gedreht über den Fehlerbalken zu platzieren
- einzelne Werte manuell bei großen Standardabweichungen zu verschieben, geht das? (Standardabweichung bei Stamm5 im Bsp. deutlich höher als bei den restlichen Daten)
- alternativ die Werte evtl. in der Mitte des Balkens anzuzeigen.
Nun der Code, soweit ich gekommen bin:
\documentclass{scrartcl}
\usepackage{pgfplots}
\pgfplotsset{/pgf/number format/use comma}
\usetikzlibrary{patterns}

\begin{filecontents*}{data.txt}
Name	x	T1	st1	T2	st2	T3	st3
Stamm1	1	80	4.5	70	3.2	65	2
Stamm2	2	50	2	45	0.5	42	1
Stamm3	3	45	3	40	1	35	3
Stamm4	4	60	1.5	50	1.5	48	1.5
Stamm5	5	150	8	154	15	149	7
Stamm6	6	140	7	150	3	148	4
\end{filecontents*}

\begin{document}

\begin{tikzpicture}
   \begin{axis}[
   	ybar=1pt,  %configures bar shift
   	ylabel={Dauer},
	width=12cm,
    xticklabels from table={data.txt}{Name},
   	xtick=data,
   	ticklabel style={/pgf/number format/.cd, use comma, 1000 sep = {}},
   	nodes near coords,
	nodes near coords align={rotate=45, /pgf/number format/precision=0},
%    every node near coord/.append style={
%    rotate=45,
%      font=\scriptsize,
%      /pgf/number format/precision=0,
%      anchor=north,
%		at={(\coordindex,\coordindex+5)}},
%   	enlargelimits=auto,
	ymajorgrids=true,
	legend pos= north west,% Legende oben links in Abb.
	legend cell align=right% Rechtsbündige Ausrichtung der Legende
	]
     \addplot
		[draw = blue,
		 fill = blue!30!white,
         error bars/.cd,
         y dir=both,
         y explicit,
         error mark=triangle*,
         error bar style={color=black}]
       table[
         x=x,
         y=T1,
         y error=st1
       ]
     {data.txt};
     \addlegendentry{T1};
     \addplot
		[draw = red,
		 fill=white,
		 postaction={pattern=north east lines,pattern color=red!30!white},
         error bars/.cd,
         y dir=both,
         y explicit,
         error mark=triangle*,
         error bar style={color=black}]
       table[
         x=x,
         y=T2,
         y error=st2
       ]
     {data.txt};
     \addlegendentry{T2};
     \addplot
		[draw = green,
		 fill=white,
		 postaction={pattern=north west lines,pattern color=green!30!white},
         error bars/.cd,
         y dir=both,
         y explicit,
         error mark=triangle*,
         error bar style={color=black}]
       table[
         x=x,
         y=T3,
         y error=st3
       ]
     {data.txt};
     \addlegendentry{T3};
   \end{axis}
\end{tikzpicture}

\end{document}