Ich habe es endlich geschafft mit eine Vorlage für Pol- Nullstellendiagramme mit Latex zu schaffen. Nun stört mich aber daran das ich die Imaginäre Achse nicht in eine wissenschaftliche Form bekomme. Damit meine ich das oben an der 10^3 steht und somit anstelle von 6000 nur eine 6 ist. Hat jemand eine gute Idee?
Hier mal mein Beispiel
\documentclass[margin=10pt]{standalone}
\usepackage{pgfplots}
\begin{document}
\begin{tikzpicture}
\begin{axis}[scale only axis,
grid=both,
height=5cm, width=6cm,
xlabel={Reale Achse},
ylabel style={
text width=5cm,align=center,
anchor=north,at={(rel axis cs:-0.2,0.5)}
},
ylabel={Imaginäre Achse}]
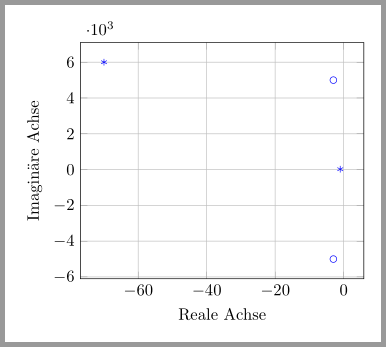
\addplot[mark=o, only marks, samples=8, color=blue] coordinates{(-3,5000) (-3,-5000)};
\addplot[mark=asterisk, only marks, samples=8, color=blue] coordinates{(-1,20) (-70,6000)};
\end{axis}
\end{tikzpicture}
\end{document}