ich habe eine Frage zur Positionierung von tikzpictures, für Minimalbeispiel siehe anbei.
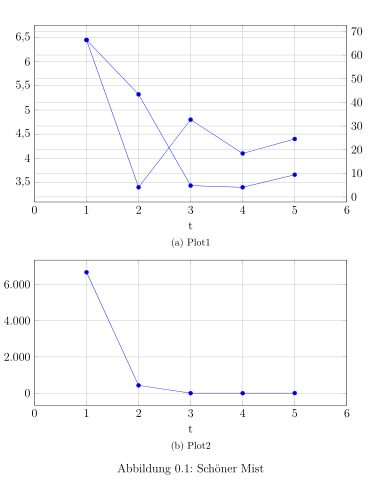
Zur Anordnung der beiden pgf-plots mit gleicher x Achse nutze ich "trim axis left" als Argument für den tikz-Aufruf. Das funktioniert auch wunderschön, solange keine zweite y-Achse ins Spiel kommt. Ich möchte eines der beiden Bilder mit zwei y Achsen haben (per axis-overlay) und die Zeichenbereiche sollen exakt gleich breit sein.
Könnt ihr mir helfen? Vielen Dank
Andreas
\documentclass[a4paper,12pt]{scrreprt}
\usepackage{lmodern}
\usepackage{pifont}
\usepackage[german]{babel}
\selectlanguage{german}
\usepackage[T1]{fontenc}
\usepackage{float}
\usepackage[hang,font=singlespacing]{caption}
\usepackage{tikz}
\usepackage{pgfplots}
\pgfplotsset{/pgf/number format/use comma, compat=newest}
\usetikzlibrary{patterns}
\usepackage{subfig}

\begin{document}
\begin{figure}
\begin{center}

\subfloat[Plot1]{
\begin{tikzpicture}[trim axis left]
	\begin{axis}[width=0.8\textwidth,height=0.35\textheight,
	%axis  y  line*=left,%    the  ’*’  avoids  arrow  heads
	grid,
	xlabel near ticks,
  ylabel near ticks,
	xmin=0,
	xmax=6,
	xlabel={t}]
	\addplot coordinates {(1,6.45)(2,3.4)(3,4.8)(4,4.1)(5,4.4)};

	\end{axis}
%
	\begin{axis}[width=0.8\textwidth,height=0.35\textheight,
	axis  y  line*=right,
	grid,
	xmin=0,
	xmax=6,
	xlabel near ticks,
  ylabel near ticks]
      \addplot coordinates {(1,66.4)(2,43.4)(3,4.8)(4,4.1)(5,9.4)};
		\end{axis}
\end{tikzpicture}

}

\subfloat[Plot2]{
\begin{tikzpicture}[trim axis left]
	  \begin{axis}[width=0.8\textwidth,height=0.3\textheight,
		grid,
		xmin=0,
   	xmax=6,
		xlabel={t},
		legend pos=north east]
      \addplot coordinates {(1,6666.4)(2,433.4)(3,4.8)(4,4.1)(5,9.4)};
			\end{axis}


	\end{tikzpicture}
}

\caption{Schöner Mist}
\end{center}
\end{figure}

\end{document}