ich möchte gern innerhalb eines Nodes ein Tikzpicture anlegen, wobei ich bestimmte Farben des Bildes generisch halten kann.
Aus Testzwecken habe ich Mein Bild zunächst ohne der generischen Variante geschrieben:
\documentclass{scrartcl}
%encoding and language
\usepackage[utf8]{inputenc}
\usepackage[T1]{fontenc}
\usepackage[english]{babel}
%diagrams and graphics
\usepackage[svgnames]{xcolor}
\usepackage{tikz}
\usetikzlibrary{automata, arrows, positioning, matrix, calc, arrows}
\usepackage{color}
\usepackage{graphicx}
\begin{document}
\begin{tikzpicture}[->,>=stealth',shorten >=1pt, auto, thick, every text node part/.style={align=center}]
\tikzstyle{cyk} = [rectangle, draw=none, minimum width=.1cm, minimum height=.1cm]
%States
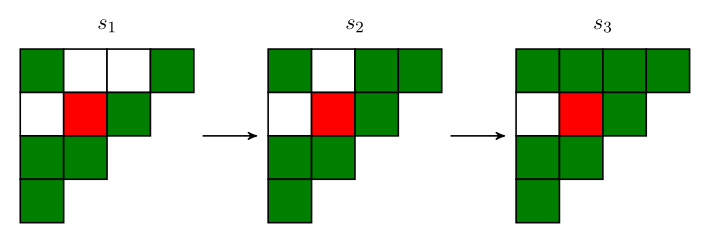
\node[cyk, label=above:$s_1$] (1)
{
\begin{tikzpicture}
\matrix(M)[matrix of math nodes,row sep=-\pgflinewidth,column sep=-\pgflinewidth, nodes={draw,minimum width=2em,minimum height=2em,font=\strut}]
{
\node[fill=Green]{}; & \node[fill=White]{}; & \node[fill=White]{}; & \node[fill=Green]{}; \\
\node[fill=White]{}; & \node[fill=Red]{}; & \node[fill=Green]{}; \\
\node[fill=Green]{}; & \node[fill=Green]{}; \\
\node[fill=Green]{}; \\
};
\end{tikzpicture}
};
\node[cyk, label=above:$s_2$] (2) [right=of 1]
{
\begin{tikzpicture}
\matrix(M)[matrix of math nodes,row sep=-\pgflinewidth,column sep=-\pgflinewidth, nodes={draw,minimum width=2em,minimum height=2em,font=\strut}]
{
\node[fill=Green]{}; & \node[fill=White]{}; & \node[fill=Green]{}; & \node[fill=Green]{}; \\
\node[fill=White]{}; & \node[fill=Red]{}; & \node[fill=Green]{}; \\
\node[fill=Green]{}; & \node[fill=Green]{}; \\
\node[fill=Green]{}; \\
};
\end{tikzpicture}
};
%Transitions
\path[->] (1) edge (2);
\end{tikzpicture}
\end{document}

Allerdings scheiter ich nun daran die Farben meiner Tabellen zu parametrisieren.
Ich habe in diversen Foren gestöbert, jedoch keine Lösung gefunden.
Mein kläglicher Versuch ist der folgende:
\documentclass{scrartcl}

%encoding and language
\usepackage[utf8]{inputenc}
\usepackage[T1]{fontenc}
\usepackage[english]{babel}

%diagrams and graphics
\usepackage[svgnames]{xcolor}
\usepackage{tikz}
\usetikzlibrary{automata, arrows, positioning, matrix, calc, arrows}
\usepackage{color}
\usepackage{graphicx}

\begin{document}

\newcommand{\cykstate}[5]
{
	\foreach[count=\i] \j in {#1, #2, #3, #4, #5}
	{
		\ifcase\j
			\cellcolor\i=Red
		\or
			\cellcolor\i=Green
		\else
			\cellcolor\i=White
		\fi
	}
	\begin{tikzpicture}
		\matrix(M)[matrix of math nodes,row sep=-\pgflinewidth,column sep=-\pgflinewidth, nodes={draw,minimum width=2em,minimum height=2em,font=\strut}]
		{
			\node[fill=Green]{}; & \node[fill=\cellcolor5]{}; & \node[fill=\cellcolor3]{}; & \node[fill=Green]{}; \\
         	\node[fill=\cellcolor4]{}; & \node[fill=\cellcolor2]{}; & \node[fill=Green]{}; \\
         	\node[fill=\cellcolor1]{}; & \node[fill=Green]{}; \\
         	\node[fill=Green] \\
		};
	\end{tikzpicture}
}

\begin{tikzpicture}[->,>=stealth',shorten >=1pt, auto, thick, every text node part/.style={align=center}]
	\tikzstyle{cyk} = [rectangle, draw=none, minimum width=.1cm, minimum height=.1cm]
	%States
	\node[cyk, label=above:$s_1$] (1) {\cykstate{1}{0}{2}{2}{2}};
	\node[cyk, label=above:$s_2$] (2) [right=of 1] {\cykstate{1}{0}{1}{2}{2}};
	%Transitions
	\path[->] (1) edge (2);
\end{tikzpicture}

\end{document}
Jedoch kann ich den Fehler nicht sehen.
Ich habe die Log-Datei beigefügt und wäre sehr dankbar, wenn mir jemand helfen könnte.[/img][/code]