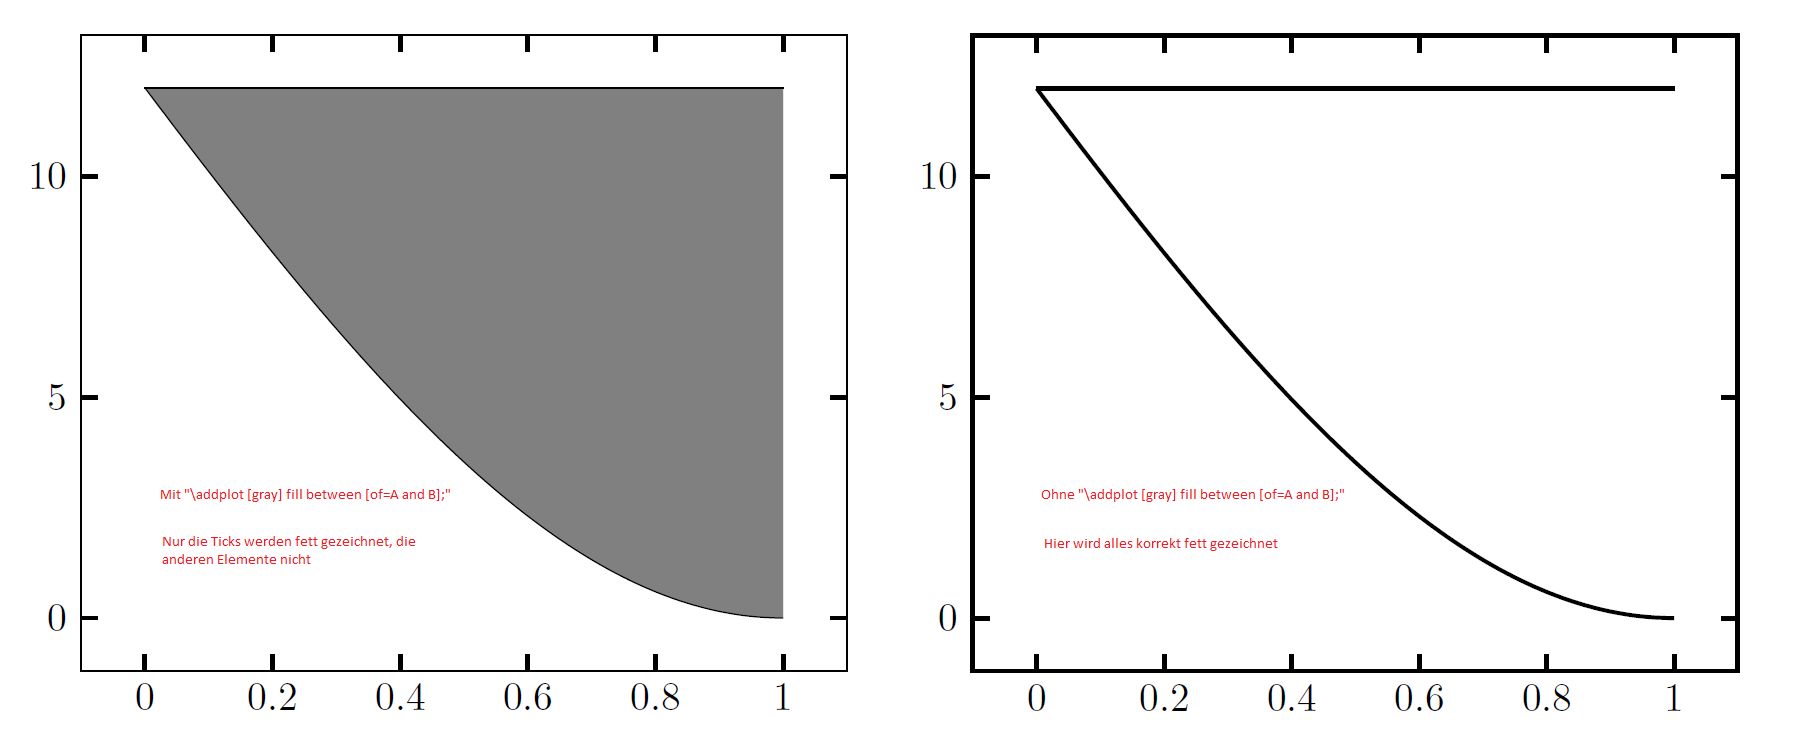
hier eine Kleinigkeit, die mich verwirrt: Ich zeichne zwei Plots und möchte den Bereich zwischen ihnen farbig markieren. Das klappt ganz gut mit der Bibliothek "fillbetween" von pgfplots. Allerdings ignoriert der fillbetween-Plot globale Einstellungen bzgl. der Strichstärke. Das passiert nicht, wenn ich kein fillbetween-Plot hinzufüge. Daher frage ich mich, ob es sich womöglich um einen Bug handelt. Wie kann ich den umgehen? Hier ein MWE:
\documentclass[border=1cm]{standalone}
\usepackage{tikz,pgfplots,pgfplotstable}

\pgfplotsset{
	compat=newest,
	every axis/.style={line width=1pt},
	every tick/.style={line width=1pt},
}

\pgfplotstableset{
	col sep=semicolon,
	row sep=newline,
}

\usepgfplotslibrary{fillbetween}

\begin{document}
\begin{tikzpicture}
\begin{axis}[samples=200]

\addplot [name path=A,domain=0:1] {60-60^2/(60+(1-x)^2*15)};

\addplot [name path=B,mark=none] table [x=Xi,y expr=60-60^2/(60+(1-\thisrow{Var})^2*15)] {
	Xi;Var
	0;0
	1;0
};

% Schalter: einmal mit und einmal ohne versuchen
\addplot [gray] fill between [of=A and B];

\end{axis}
\end{tikzpicture}
\end{document}