Du kannst die Plots jeweils mit `\label` versehen und am Ende eine gemeinsame Legende einfügen:
\begin{filecontents}{test.txt}
x cdf y1 pdf y2
-140 0 0 0 0
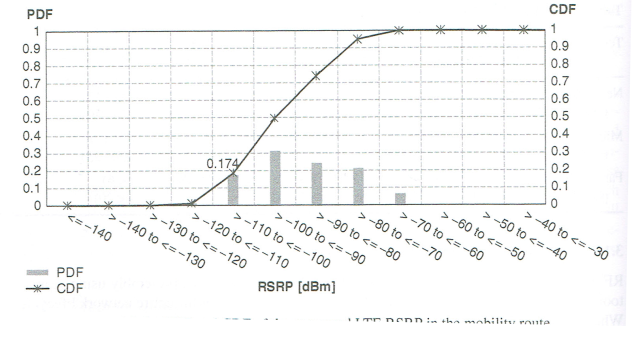
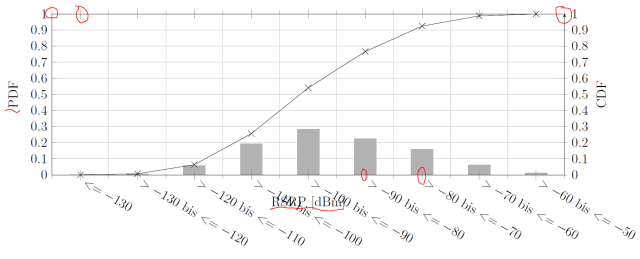
-130 13 0,000947798 13 0,000947798
-120 437 0,031860601 424 0,030912803
-110 2261 0,164843978 1824 0,132983377
-100 5843 0,425998833 3582 0,261154856
-90 9872 0,719743365 4029 0,293744532
-80 12516 0,912510936 2644 0,192767571
-70 13570 0,989355497 1054 0,076844561
-60 13716 1 146 0,010644503
-50 13716 1 0 0
-40 13716 1 0 0
-30 13716 1 0 0
\end{filecontents}
\documentclass[]{scrreprt}
\usepackage{pgfplots}
\usepgfplotslibrary{units}
\pgfplotsset{
compat=newest,
scale only axis,
width=0.8\textwidth,
height=0.3\textwidth,
major tick length = 0,
minor tick length = 0,
minor x tick num=1,
}
\begin{document}
\begin{tikzpicture}
\begin{axis}[
axis y line*=left,
xticklabels={},
xminorgrids=true, ymajorgrids=true,
grid style={dashed},
ymin=0, ymax=1, ytick distance=0.1,
ylabel={PDF},
y label style={rotate=-90, at={(0,1.05)}, anchor=south east},
bar width=20pt,
ybar,
%legend entries={PDF}, % auskommentiert
%legend style={at={(0,-0.3)},anchor=north west},
%
%Zu Anpassen
xmin=-135, xmax=-45, xtick distance=10,
]
\addplot +[color=black!30] table[x=x, y=y2,/pgf/number format/read comma as period] {test.txt};
\label{pgfplots:PDF}% hinzugefügt
\end{axis}
\begin{axis}[
axis x line*=box,
axis y line*=right,
ymin=0, ymax=1, ytick distance=0.1,
ylabel={CDF},
y label style={rotate=-90, at={(1,1.05)}, anchor=south west},
%legend entries={CDF}, % auskommentiert
%legend style={at={(0,-0.45)},anchor=north west},
%
%Zu Anpassen
xmin=-135, xmax=-45, xtick distance=10,
xticklabels={,
$\le -130$,
$>-130$ bis $\le -120$,
$>-120$ bis $\le -110$,
$>-110$ bis $\le -100$,
$>-100$ bis $\le -90$,
$>-90$ bis $\le -80$,
$>-80$ bis $\le -70$,
$>-70$ bis $\le -60$,
$>-60$ bis $\le -50$,
},
x tick label style={rotate=-30, anchor=north west,},
x unit=dBm,
xlabel={RSRP},
]
\addplot +[color=black,mark=star,mark options={scale=2,solid}] table[x=x, y=y1,/pgf/number format/read comma as period] {test.txt};
\label{pgfplots:CDF}% hinzugefügt
\end{axis}
\matrix% hinzugefügt
[/pgfplots/every axis legend,at={(0,0|-current bounding box.south)},anchor=south west]
{\node{\ref{pgfplots:PDF}}; & \node{PDF}; \\
\node{\ref{pgfplots:CDF}}; & \node{CDF}; \\};
\end{tikzpicture}
\end{document}
Wegen der Referenzen muss man das zwei Mal laufen lassen, damit die Legendenbilder korrekt angezeigt werden.
Was Du mit "Und die Grids überschneiden sich nicht immer korrekt. " meinst, ist mir nicht klar. Wenn Du möchtest, dass sich sich an den Kreuzungspunktenn jeweils Striche der Strichlinien befinden, dann musst Du die Gitterlinien in x- bzw. y-Richtung mit dash pattern und dash phase anpassen. Das dürfte aber mühselig werden.